

Bitcoin has finally broken the quiet of its sideways spell. In his video analysis of 20 October 2026, MCO analyst Ben tracks a move above a falling wedge after a weekend with little direction. The green candle gives the market something new to work with. Whether it starts a lasting recovery or draws buyers into a bull trap depends on what follows.
The first test is close by. Ben identifies resistance at $83,464, followed by $84,383, or roughly $84,400. A rally into that area would fit both of his working scenarios. Reaching it would therefore say less about the larger trend than the shape of the move and the market's ability to hold support afterwards.
Why the bounce fits two different stories
Ben reads the decline from the 21 September high as a three-part correction. In Elliott-wave terms, that leaves room for an upward response without requiring the whole trend to have turned bearish. The narrowing wedge also suggested that the decline was losing momentum. A bounce was already part of the picture.
In his more cautious blue scenario, the rebound develops into a B wave: a recovery within a correction that could eventually give way to another decline. The orange alternative allows a fifth wave higher, extending the advance that began in July. Both can initially produce rising prices, which is why the first green candle cannot distinguish them.
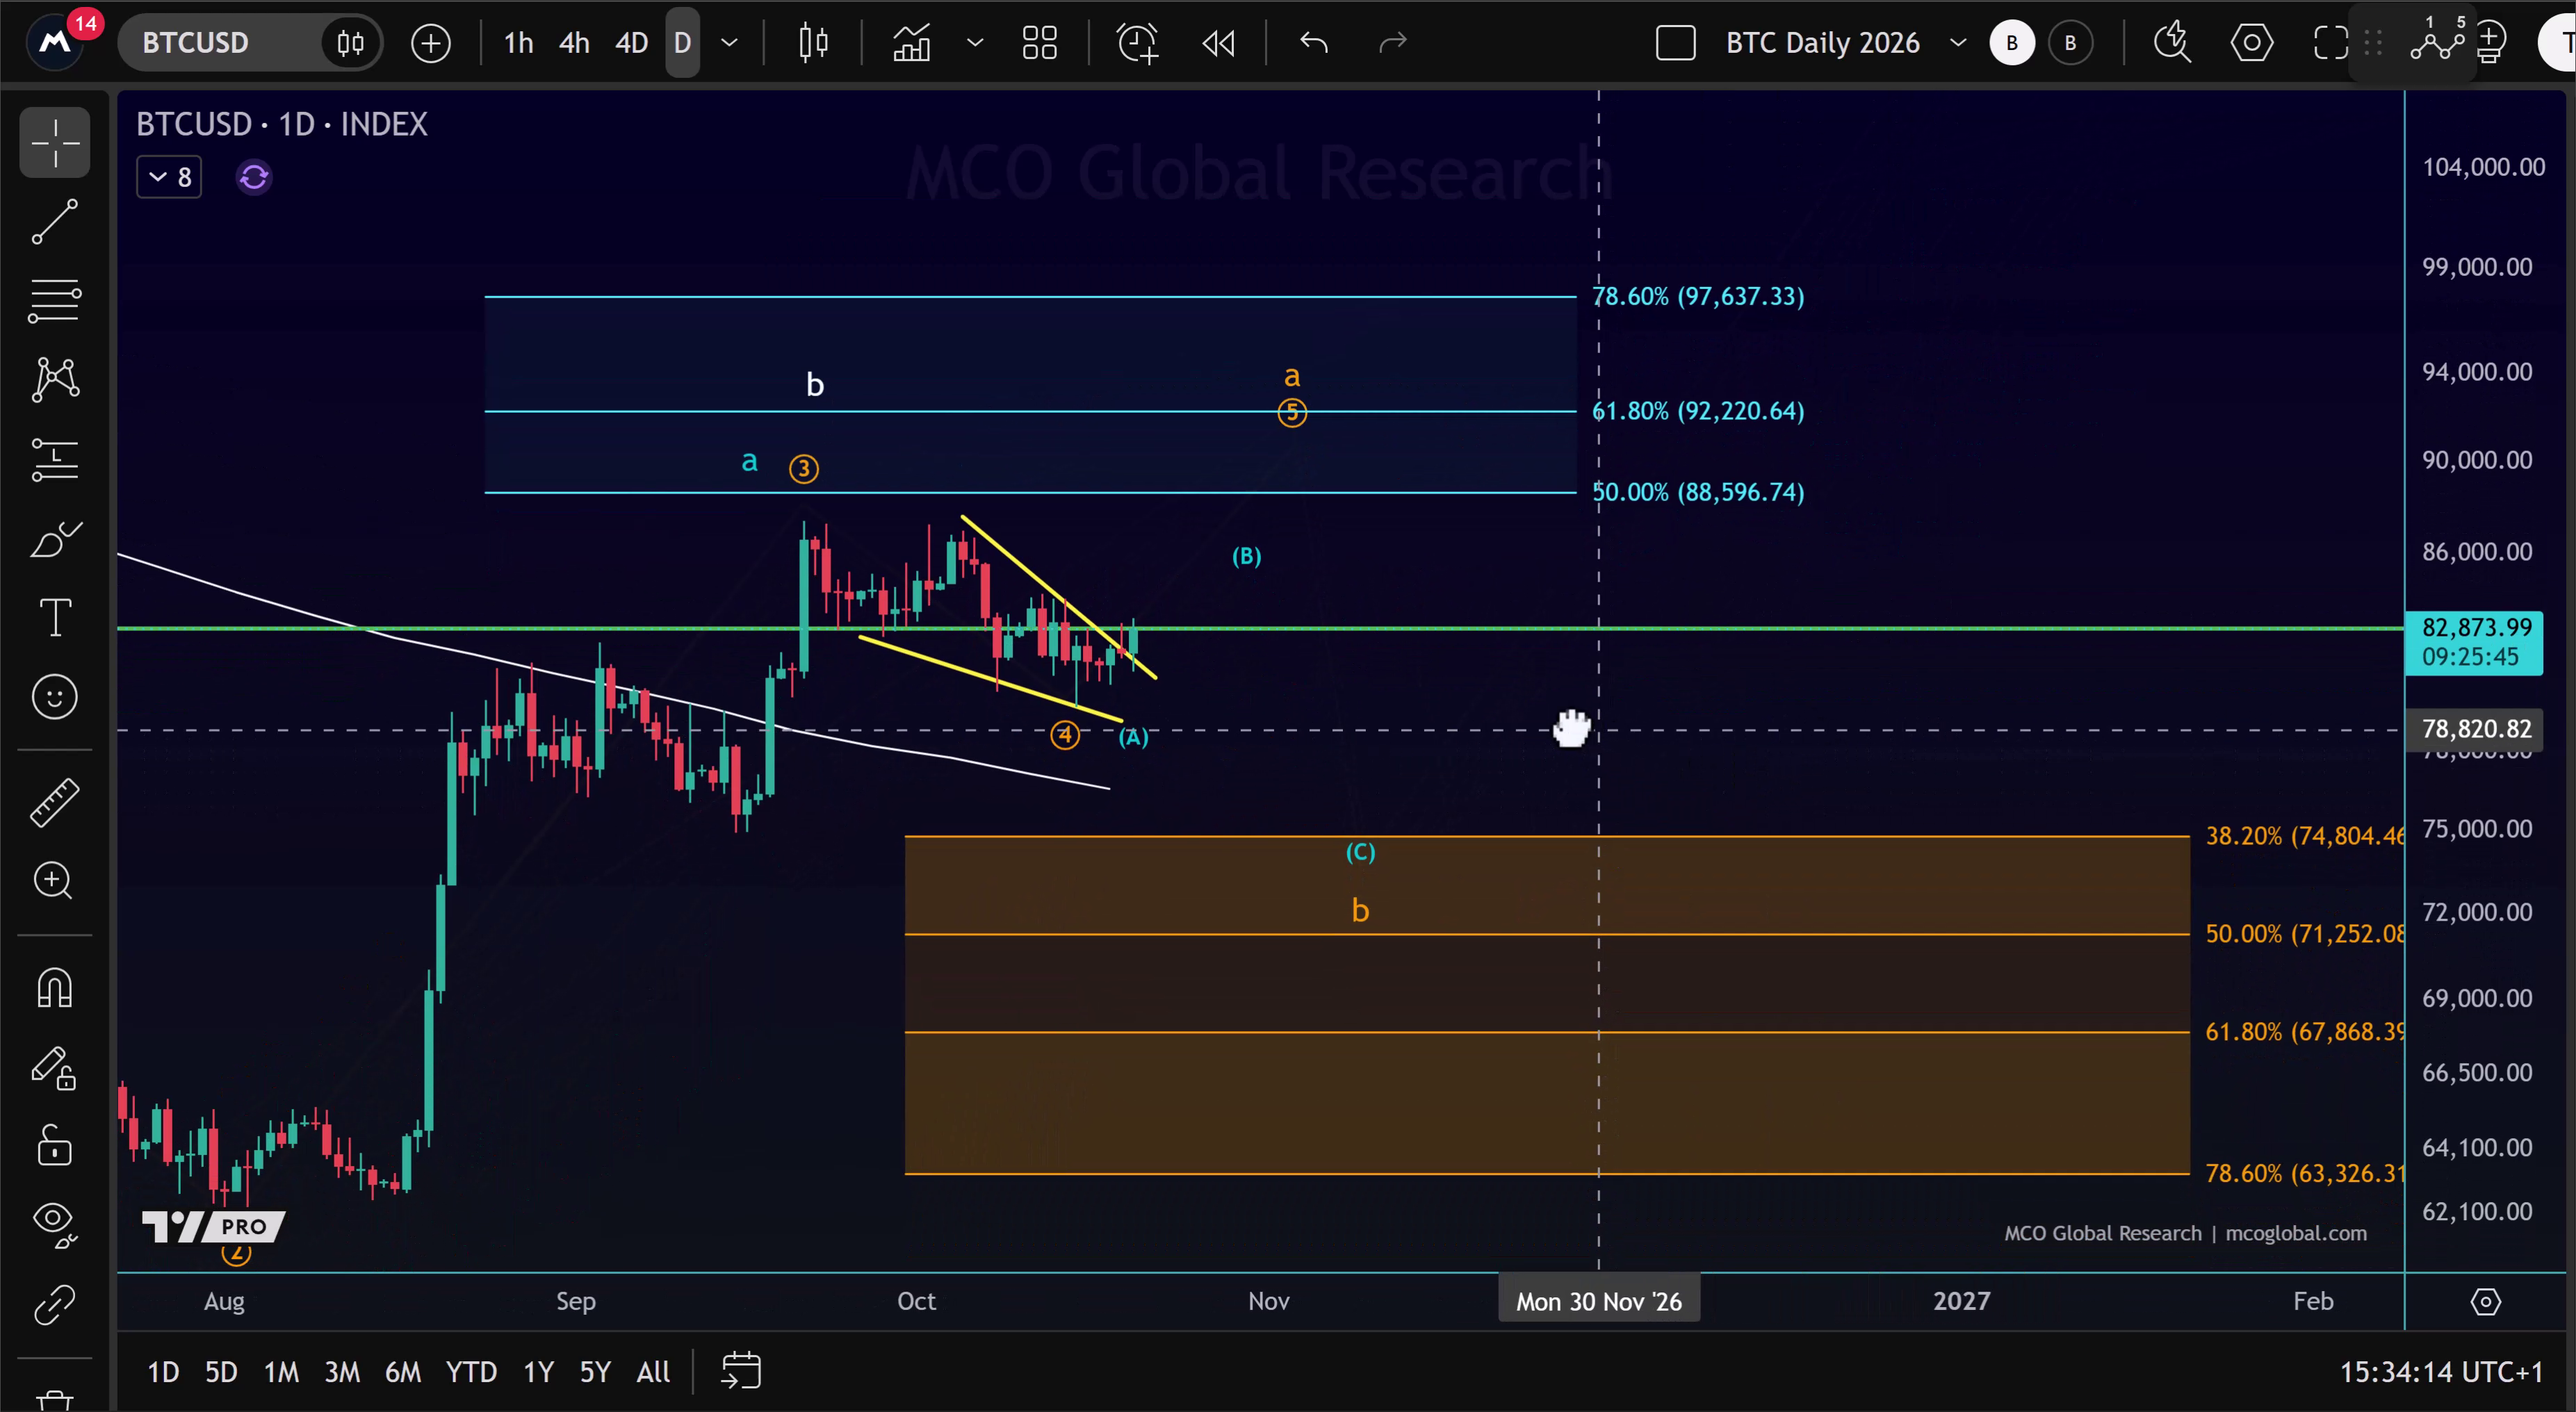
Ben initially follows the cautious scenario for risk-management reasons. He also notes that a B wave can overshoot, making a convincing-looking rally possible even within the corrective interpretation. The distinction has to emerge as the move develops.
The May high is not the deciding line
Bitcoin's attempt to regain the May high is visually striking, but Ben gives it limited weight on its own. Price has repeatedly traded above and below that area in recent days. He treats it as contested ground between buyers and sellers, rather than a single level that settles the outlook.
His closer focus is the structure on the smaller timeframe. A three-wave rise would still fit the blue corrective rebound. A five-wave advance would give him more reason to follow the orange continuation scenario. The small support levels underneath the move also matter: buyers need to defend the ground they have gained.
What would make the bullish case stronger?
The area around $84,400 brings together nearby Fibonacci measurements on Ben's chart, including a 61.8% retracement and a 100% extension. They are slightly different prices within the same resistance area. He expects that zone to become relevant even if the rebound remains corrective.
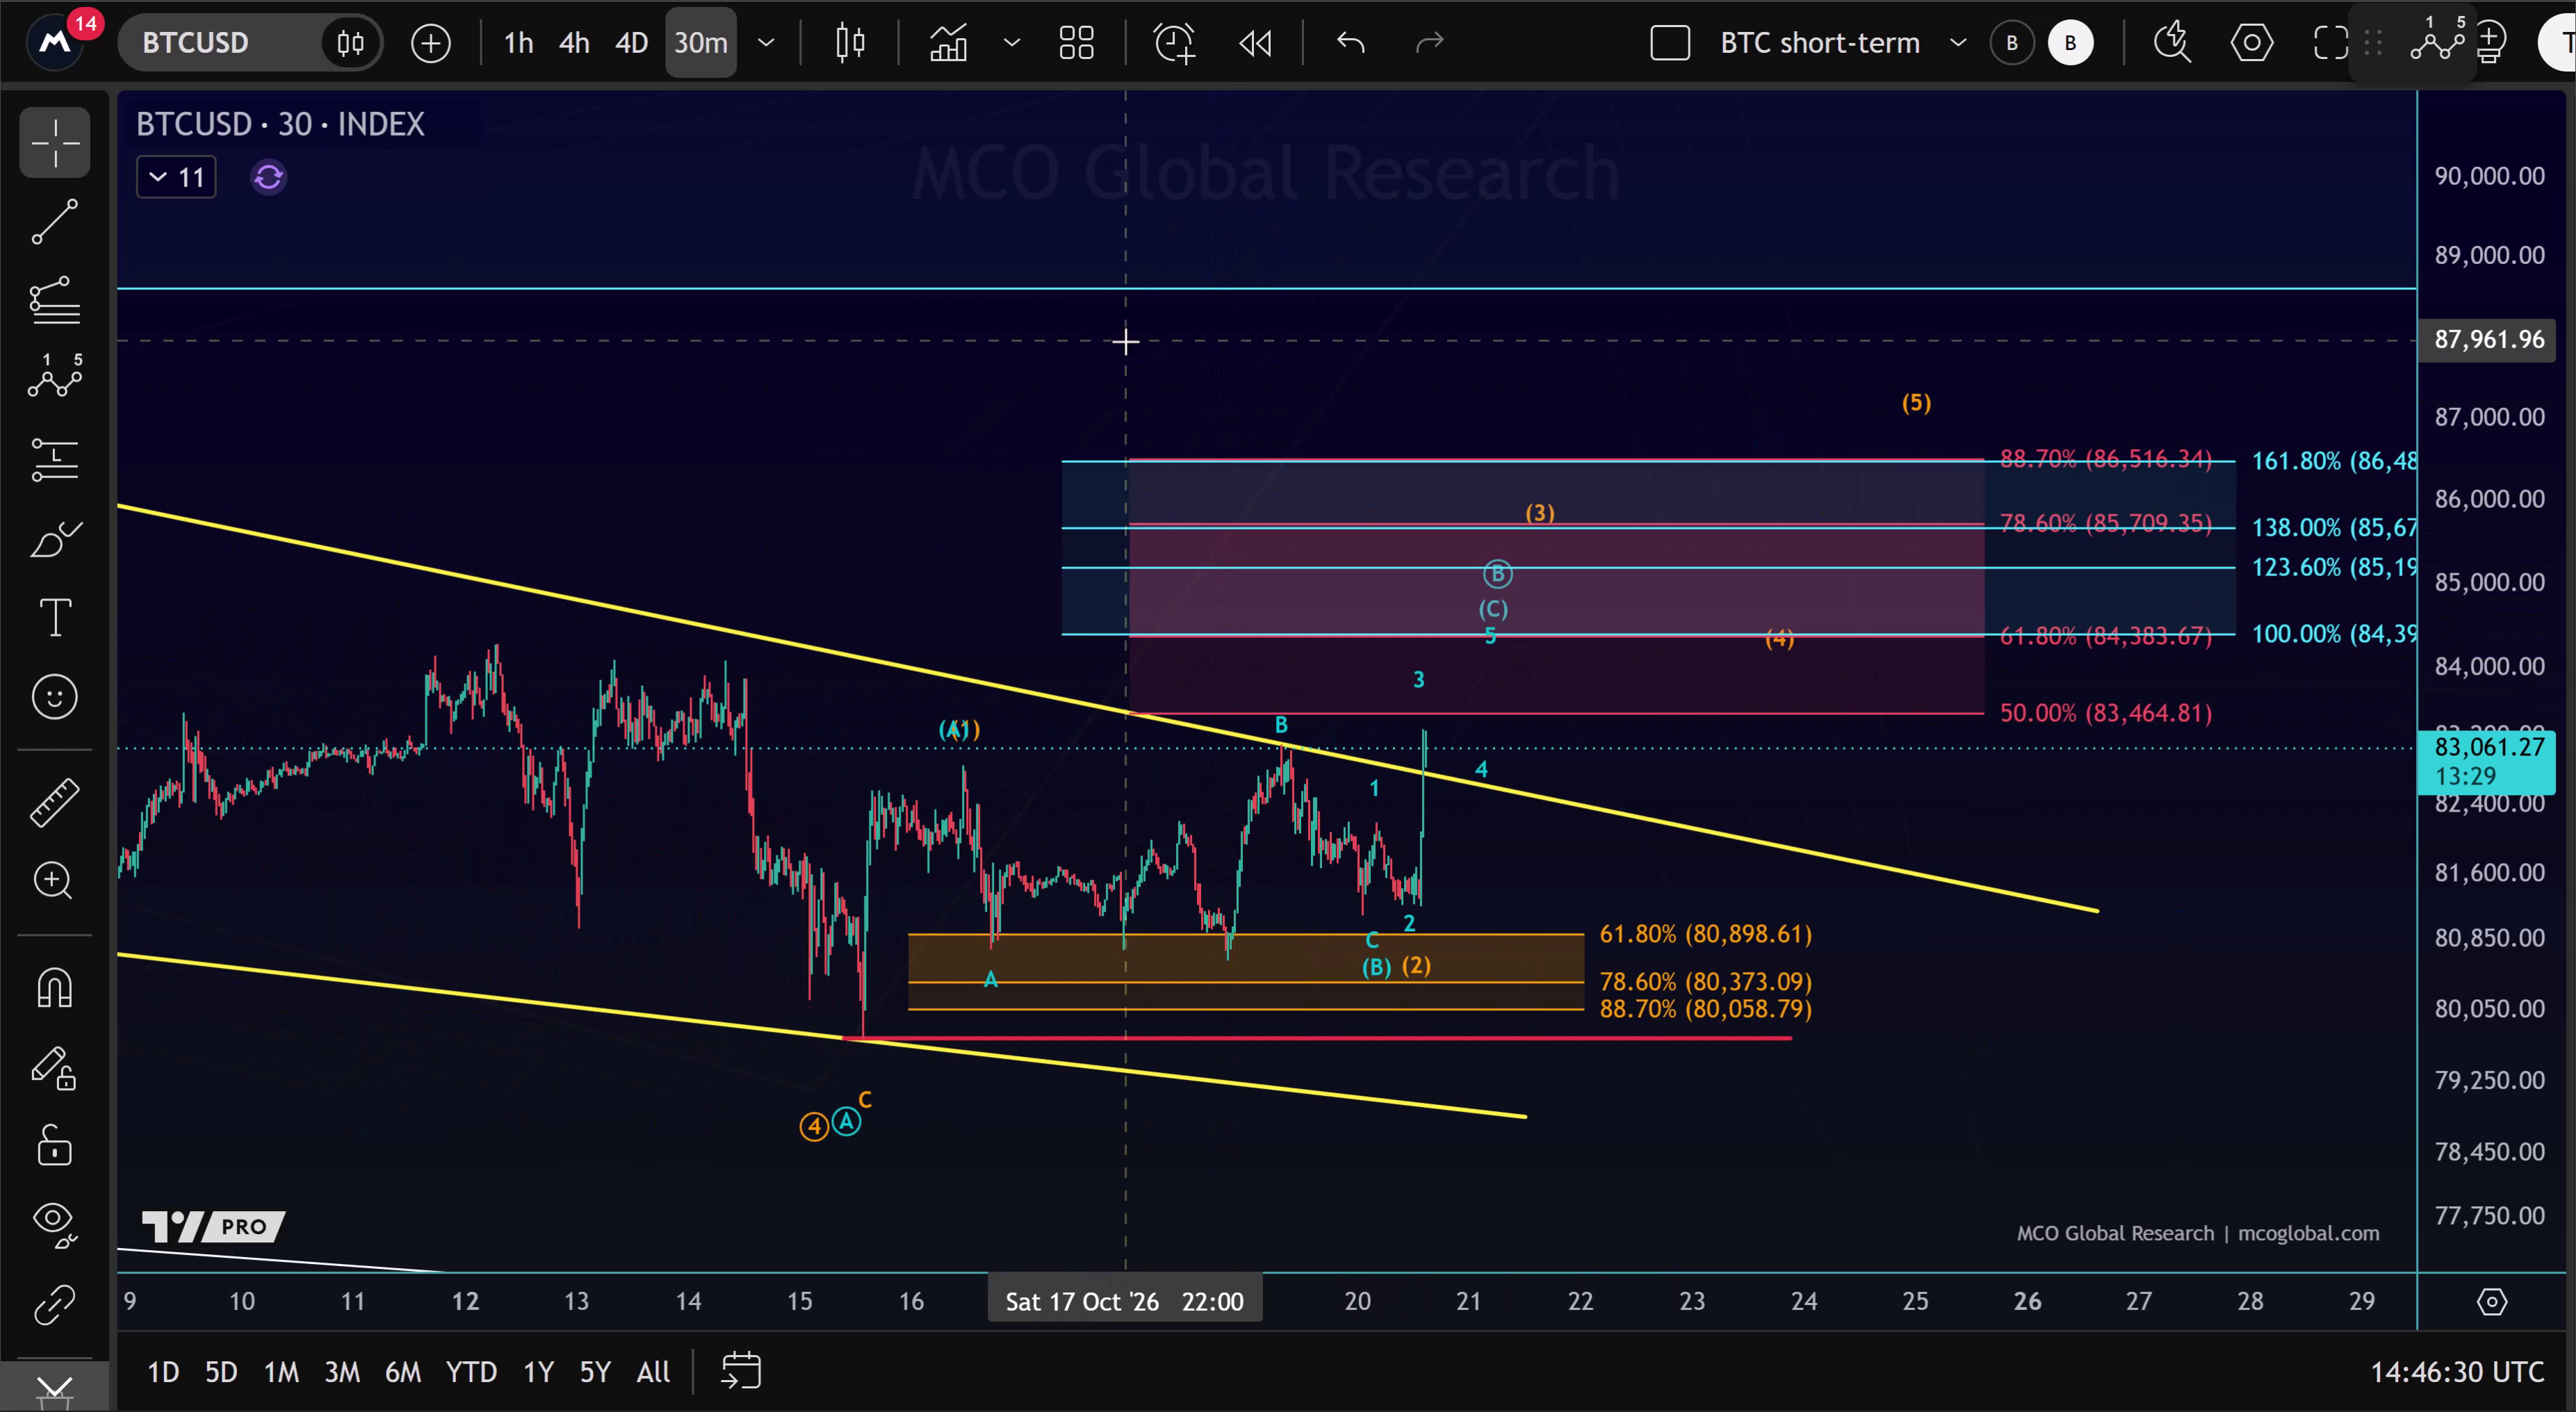
A move towards $85,700 would make Ben take the orange scenario more seriously. That area sits near a projection he associates with a developing third wave. It is a reference within the wave structure, not automatic confirmation of a trend change when the price touches or crosses it.
The next question is how Bitcoin handles those resistance areas. A rebound that stays three-part and loses its supporting structure would leave the bull-trap interpretation in play. A clearer five-wave advance with support holding would strengthen the continuation case. In the 20 October analysis, the breakout has opened that contest; it has not resolved it.
Source: Ben's Bitcoin video analysis of 20 October 2026 and the two original MCO charts shown above.