

The setup goes back to October 2025. That was when the higher-degree top formed and the corrective phase began. Price moved down into the February low, started a rally that disappointed bulls who wanted a straight line up, then extended into Q2 right up to the $82,000 target. MCO has been clear throughout this period that the move higher is a corrective bounce inside a larger bear market, not the start of a new bull. The rejection at $82K is the first concrete evidence the market is respecting that framework.
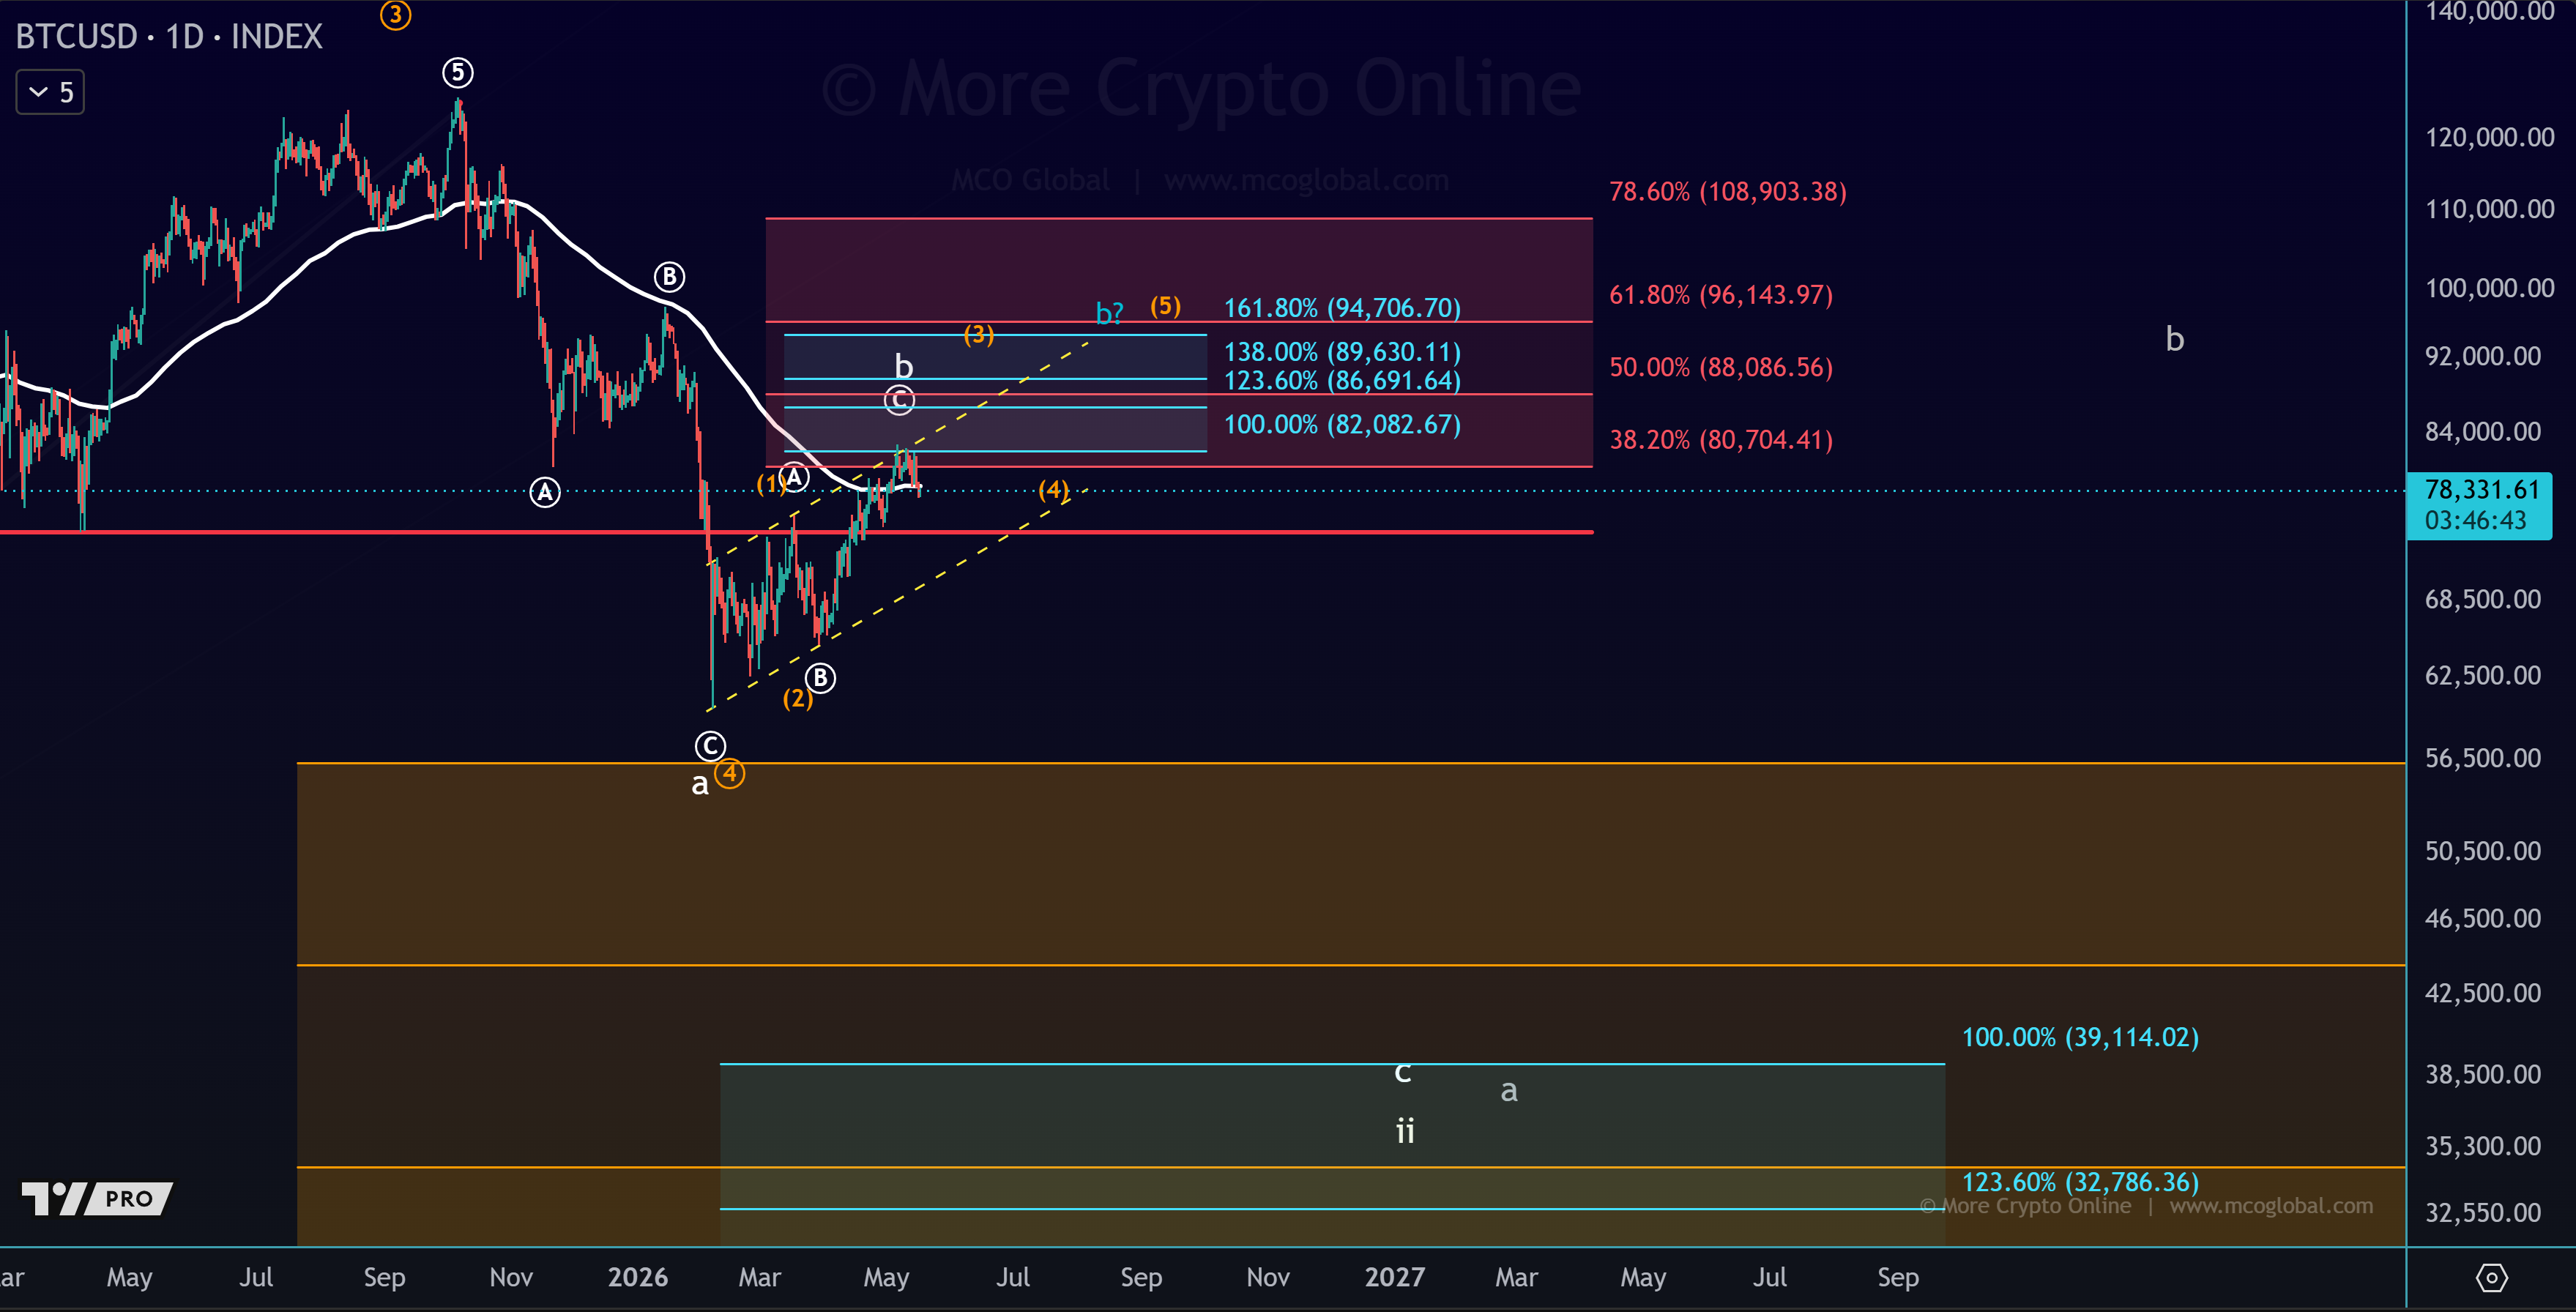
Today's price action sits in the working support band. Bitcoin slipped to roughly $78,000 overnight after $500 million in long positions got liquidated through the weekend. The critical zone defined early in May is $76,500 to $77,800. As long as that holds, the corrective rally could still extend higher, possibly into June or July. If it breaks, the structure shifts and the path to lower prices opens up directly.
Two cycle models reinforce the bigger picture. The classic four-year Bitcoin cycle, which has been historically reliable since 2014, projects bear-market completion around mid-October 2026. The MCO cycle engine, which detects the dominant rhythm in price independently of any preset cycle length, also identifies a low forming in roughly the same window. Two different mathematical frameworks pointing at the same area. That alignment is what gives the October projection weight beyond Elliott Wave on its own.
For the coming weeks, this means watching two things. On the upside, the next resistance cluster sits at $87,000 to $88,000 if Bitcoin can break decisively back above $82,000 to $83,000 first. Anything below $76,500 starts a different conversation, with the larger downside extension target near $39,000 still on the chart as the 100% extension of the bear leg already in play. None of this is a prediction. It is the framework we operate from until price tells us to change it.
MCO does not pretend to know exactly when the bear bottoms. What it can offer is structure, cycles, and invalidation points. The next few weeks are about whether the corrective rally extends one more time or rolls over here. Either way, the road to the next sustainable bull market still leads through October on the cycle clock.