Bitcoin Rejected at the 200-Day, Now Watching $74,400
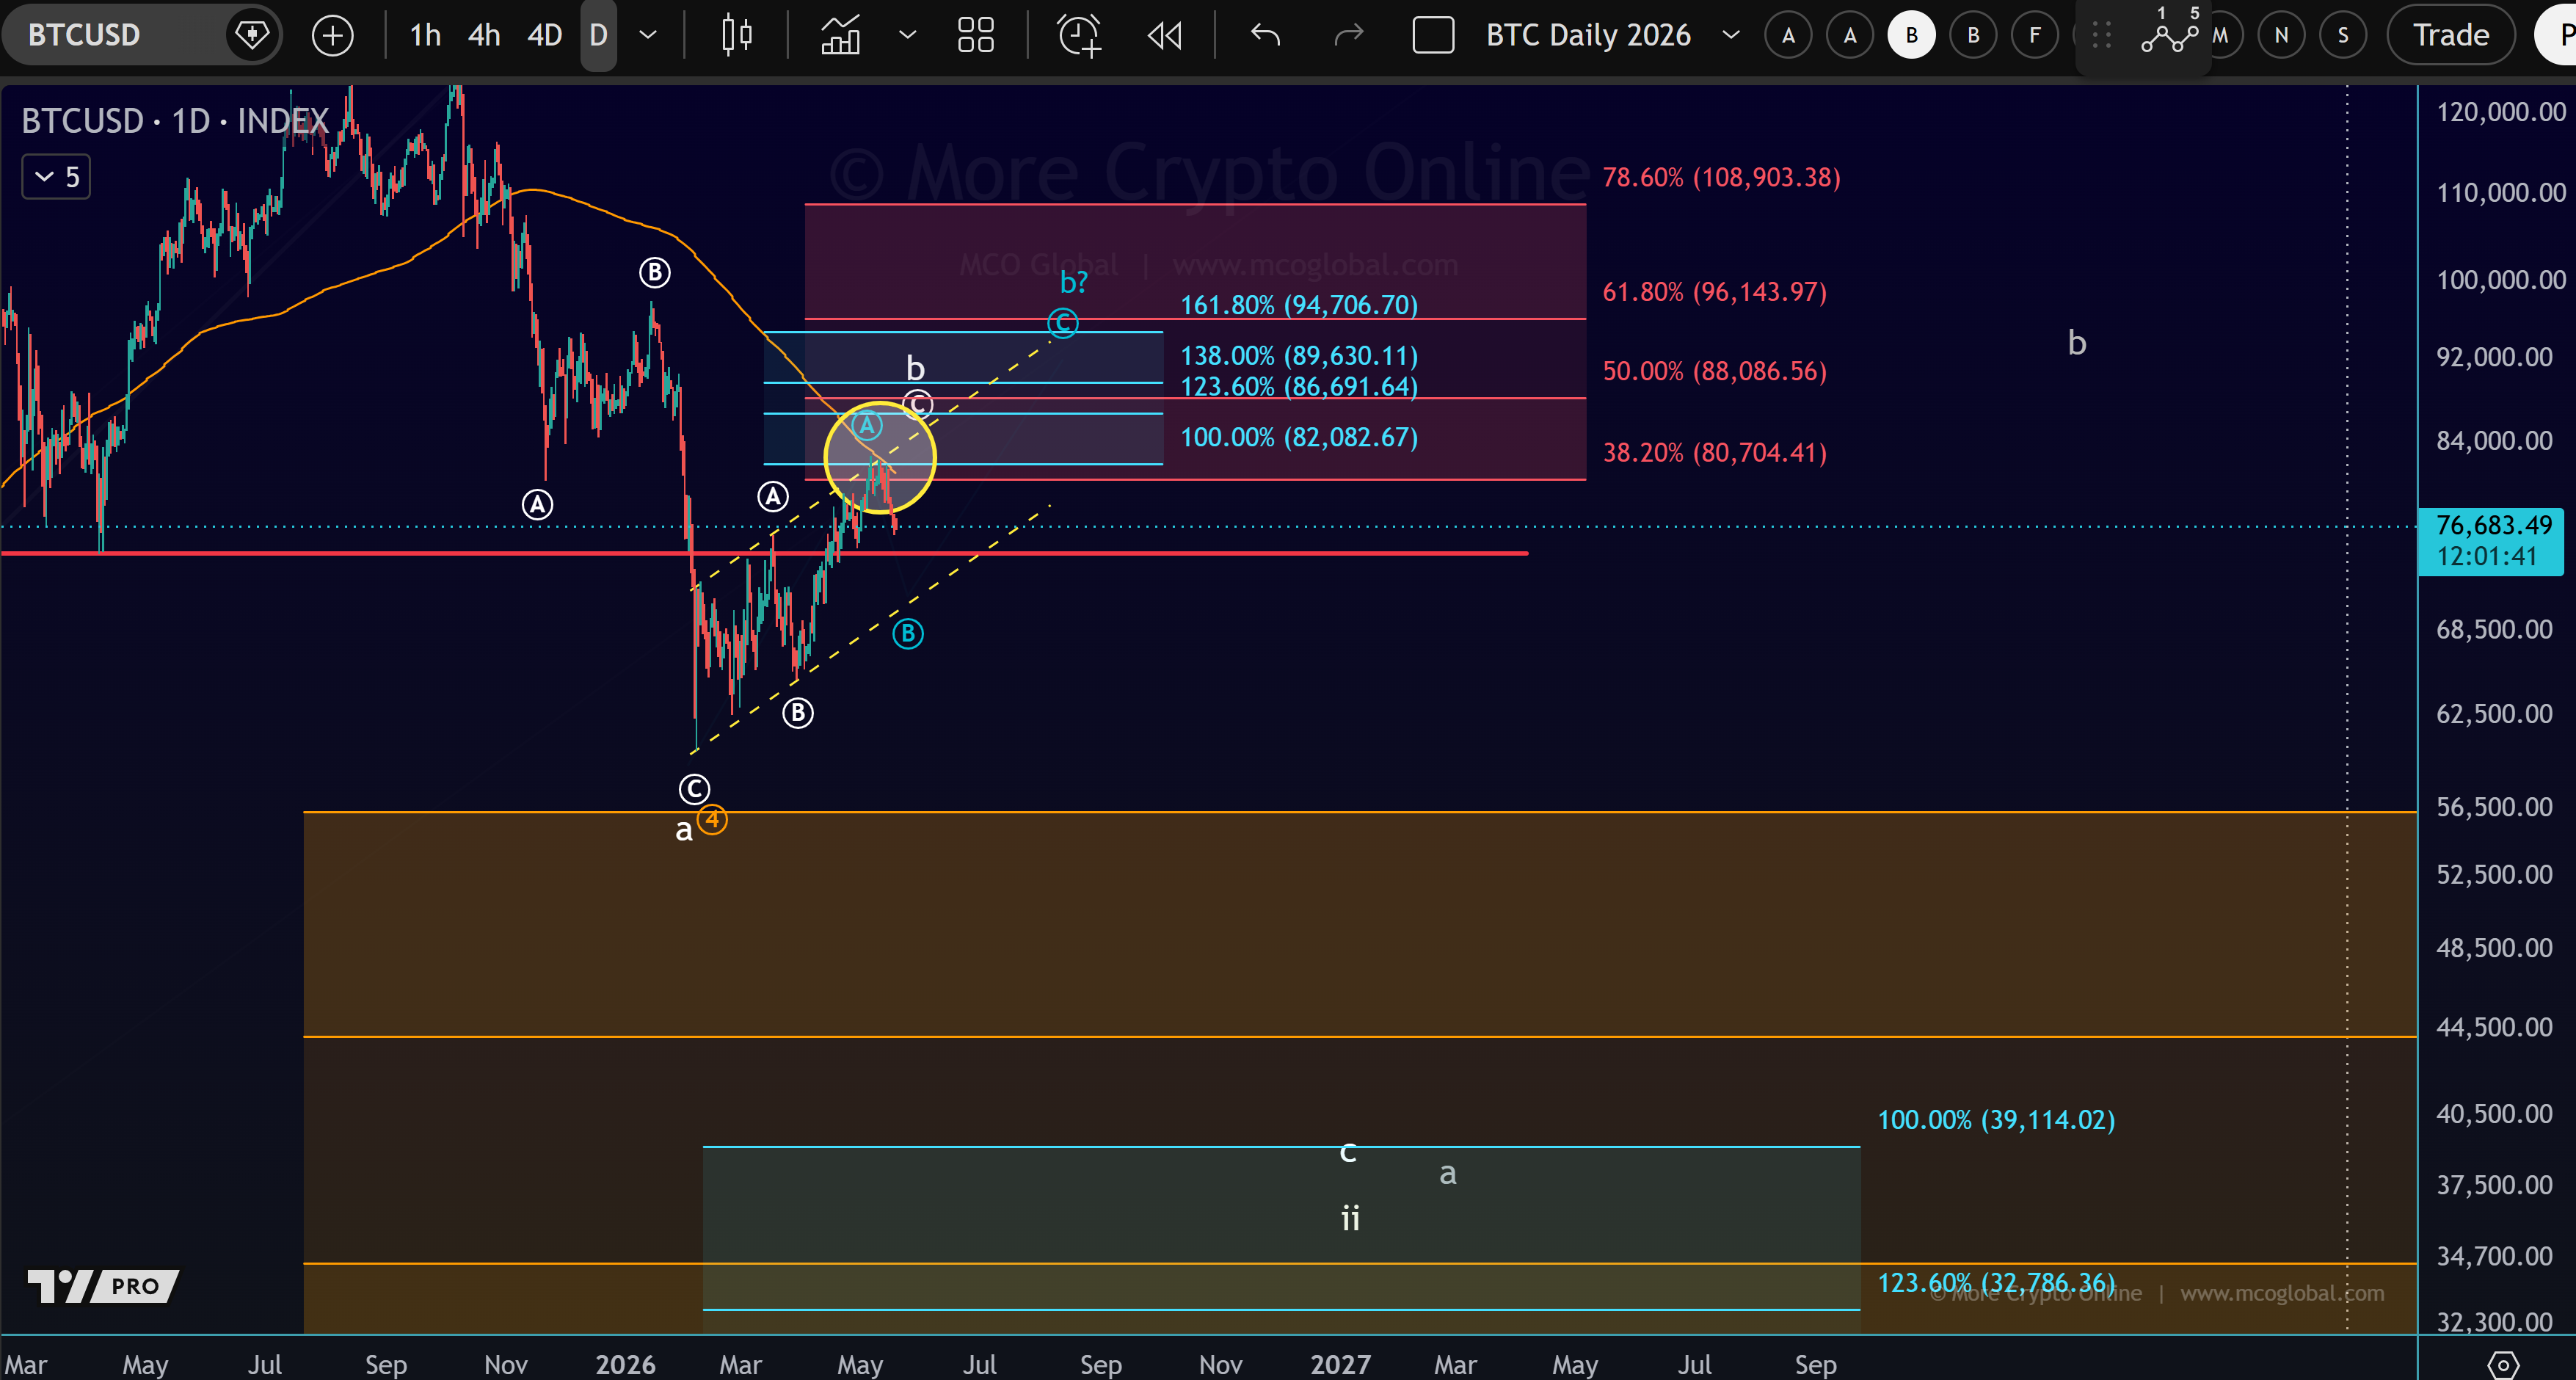
BTC tagged $82,000 and got rejected at the 100% Fibonacci extension and the 200-day moving average. The setup mirrors late-March 2022. Next decision points: $74,400 and the $69-70K channel boundary.
4 min readMCO Team
Where We Are
BTC trades around $77,100 today, down roughly 5% on the week after Trump’s weekend Iran post pushed risk assets lower. The structural picture has not changed: the rally into the high $80,000s a few weeks ago tagged the 100% Fibonacci extension at $82,000 and got rejected. That rejection is now the reference point for everything that follows.
The 200-Day Is Resistance, Not Support
The 200-day simple moving average sits at $81,400 and is sloping the wrong way. In bull markets, price uses the 200-day as a launchpad. In bear markets and corrective phases, price uses it as a ceiling. BTC is doing the second thing. Every push toward that zone has been sold so far, which is the textbook behavior of a market that has lost its trend.
Current BTC structure: rejection at $82,000, 200-day SMA as resistance, descending channel with support at $74,400 and the lower channel boundary near $69-70K.
The 2022 Parallel
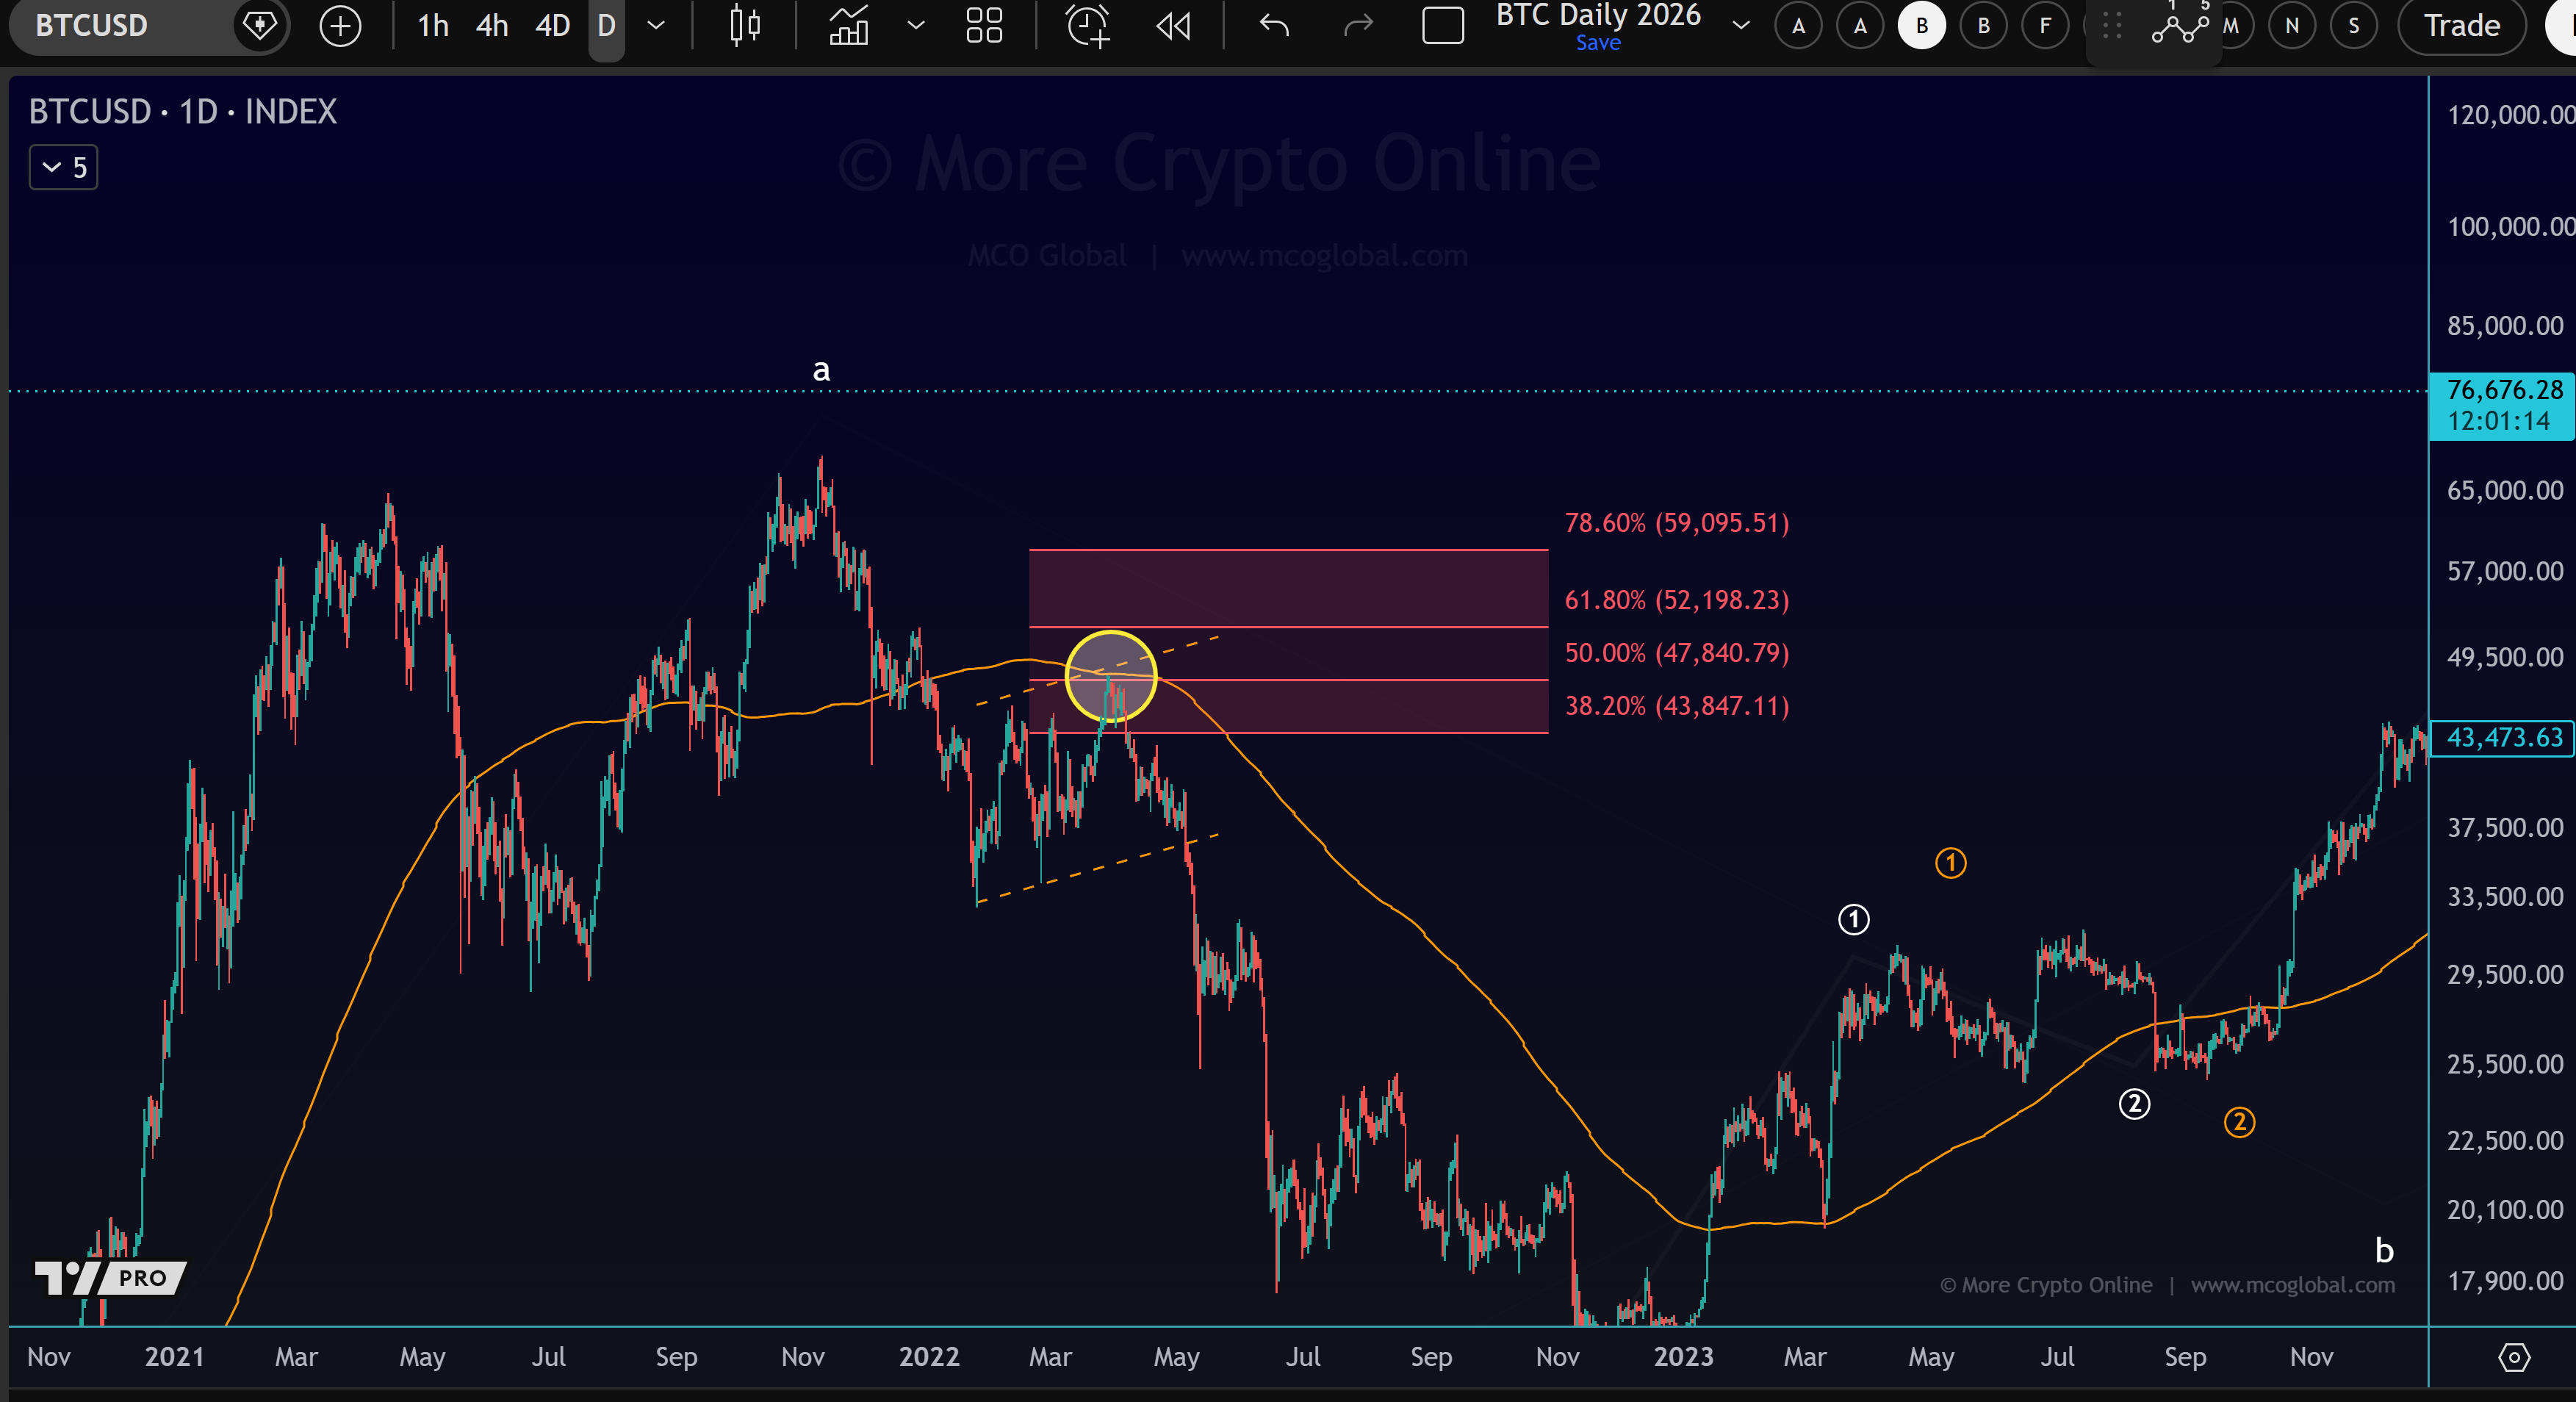
This is not a new pattern. At the end of March 2022, BTC ran up into the 200-day moving average, got rejected there, and then spent the entire rest of the bear market underneath it. The 2018 cycle showed the same behavior. Rejection at the 200-day after a downtrend has been one of the most reliable bear-market signals across cycles.
BTC during the 2022 bear market. Rejection at the 200-day MA in late March 2022 and the failure to reclaim it for the rest of the year.
The Levels That Matter Now
First support is $74,400, the red line from the April low last year. If that holds, the bear flag is still alive and a corrective rally inside the channel stays the base case. If $74,400 breaks, attention shifts to the lower boundary of the price channel near $69,000 to $70,000. That line is ascending, so it is a dynamic support, meaning the exact level moves higher with time. A clean break below the channel invalidates the bear flag and opens the door to a deeper move.
What This Means for Positioning
Until BTC closes above the 200-day, the structure stays corrective. Long setups against $74,400 and the lower channel boundary have defined risk and a logical invalidation point. Chasing rallies into the $80,000s without a confirmed reclaim is the same trade traders have lost on for the last month. The 200-day is the line that decides whether this is a pause in a downtrend or the start of a new leg up. Nothing else matters until that question is answered.
Key Takeaways
Bitcoin failed at the $82,000 zone, exactly where the 100% Fibonacci extension and the 200-day moving average sit.
The setup mirrors late-March 2022, when BTC also stalled at the 200-day MA and never reclaimed it for the rest of the bear market.
Next decision points are $74,400, then the lower channel boundary near $69,000 to $70,000. A break below that invalidates the bear flag scenario.
MCO News publishes market news and commentary for information and education. Nothing on this site is investment advice or a recommendation to buy or sell any asset. Trading and investing, including in cryptoassets, involves a high risk of loss.
Bitcoin, the indices, the dollar. Levels, invalidations and the reasoning behind them. Free, by email.
We confirm your address by email before the first issue. Opens and clicks are measured. Privacy Policy
Cookies and privacy
We use only essential browser storage (language, cached news). Market widgets from TradingView load only if you accept, and TradingView then sets its own cookies. Details in our Cookie Policy.