

The Iran tension lifts gold trade has been broken for weeks. Gold fell almost 4% over the past week, dropping to its lowest level since March. Silver had already taken a 7% beating Friday on positioning flush after running from $60s to $89 over the prior month. Now Sunday's Trump ultimatum, instead of triggering a safe-haven rally Monday, is producing another leg lower for both. Spot gold at $4,495.06 Singapore session, silver at $74.06.
The transmission mechanism runs through yields, not fear. Stalled Iran ceasefire talks keep Strait of Hormuz effectively closed. Brent stays above $111 after rising again on the Sunday news. Higher oil feeds into inflation expectations. The 10-year Treasury yield ripped 9 basis points Friday to 4.55%, the highest in a year, and Asian Monday open has yields holding there. For an asset that produces no income, the opportunity cost of holding gold goes up every basis point yields rise. That math beats the safe-haven impulse in the current regime.
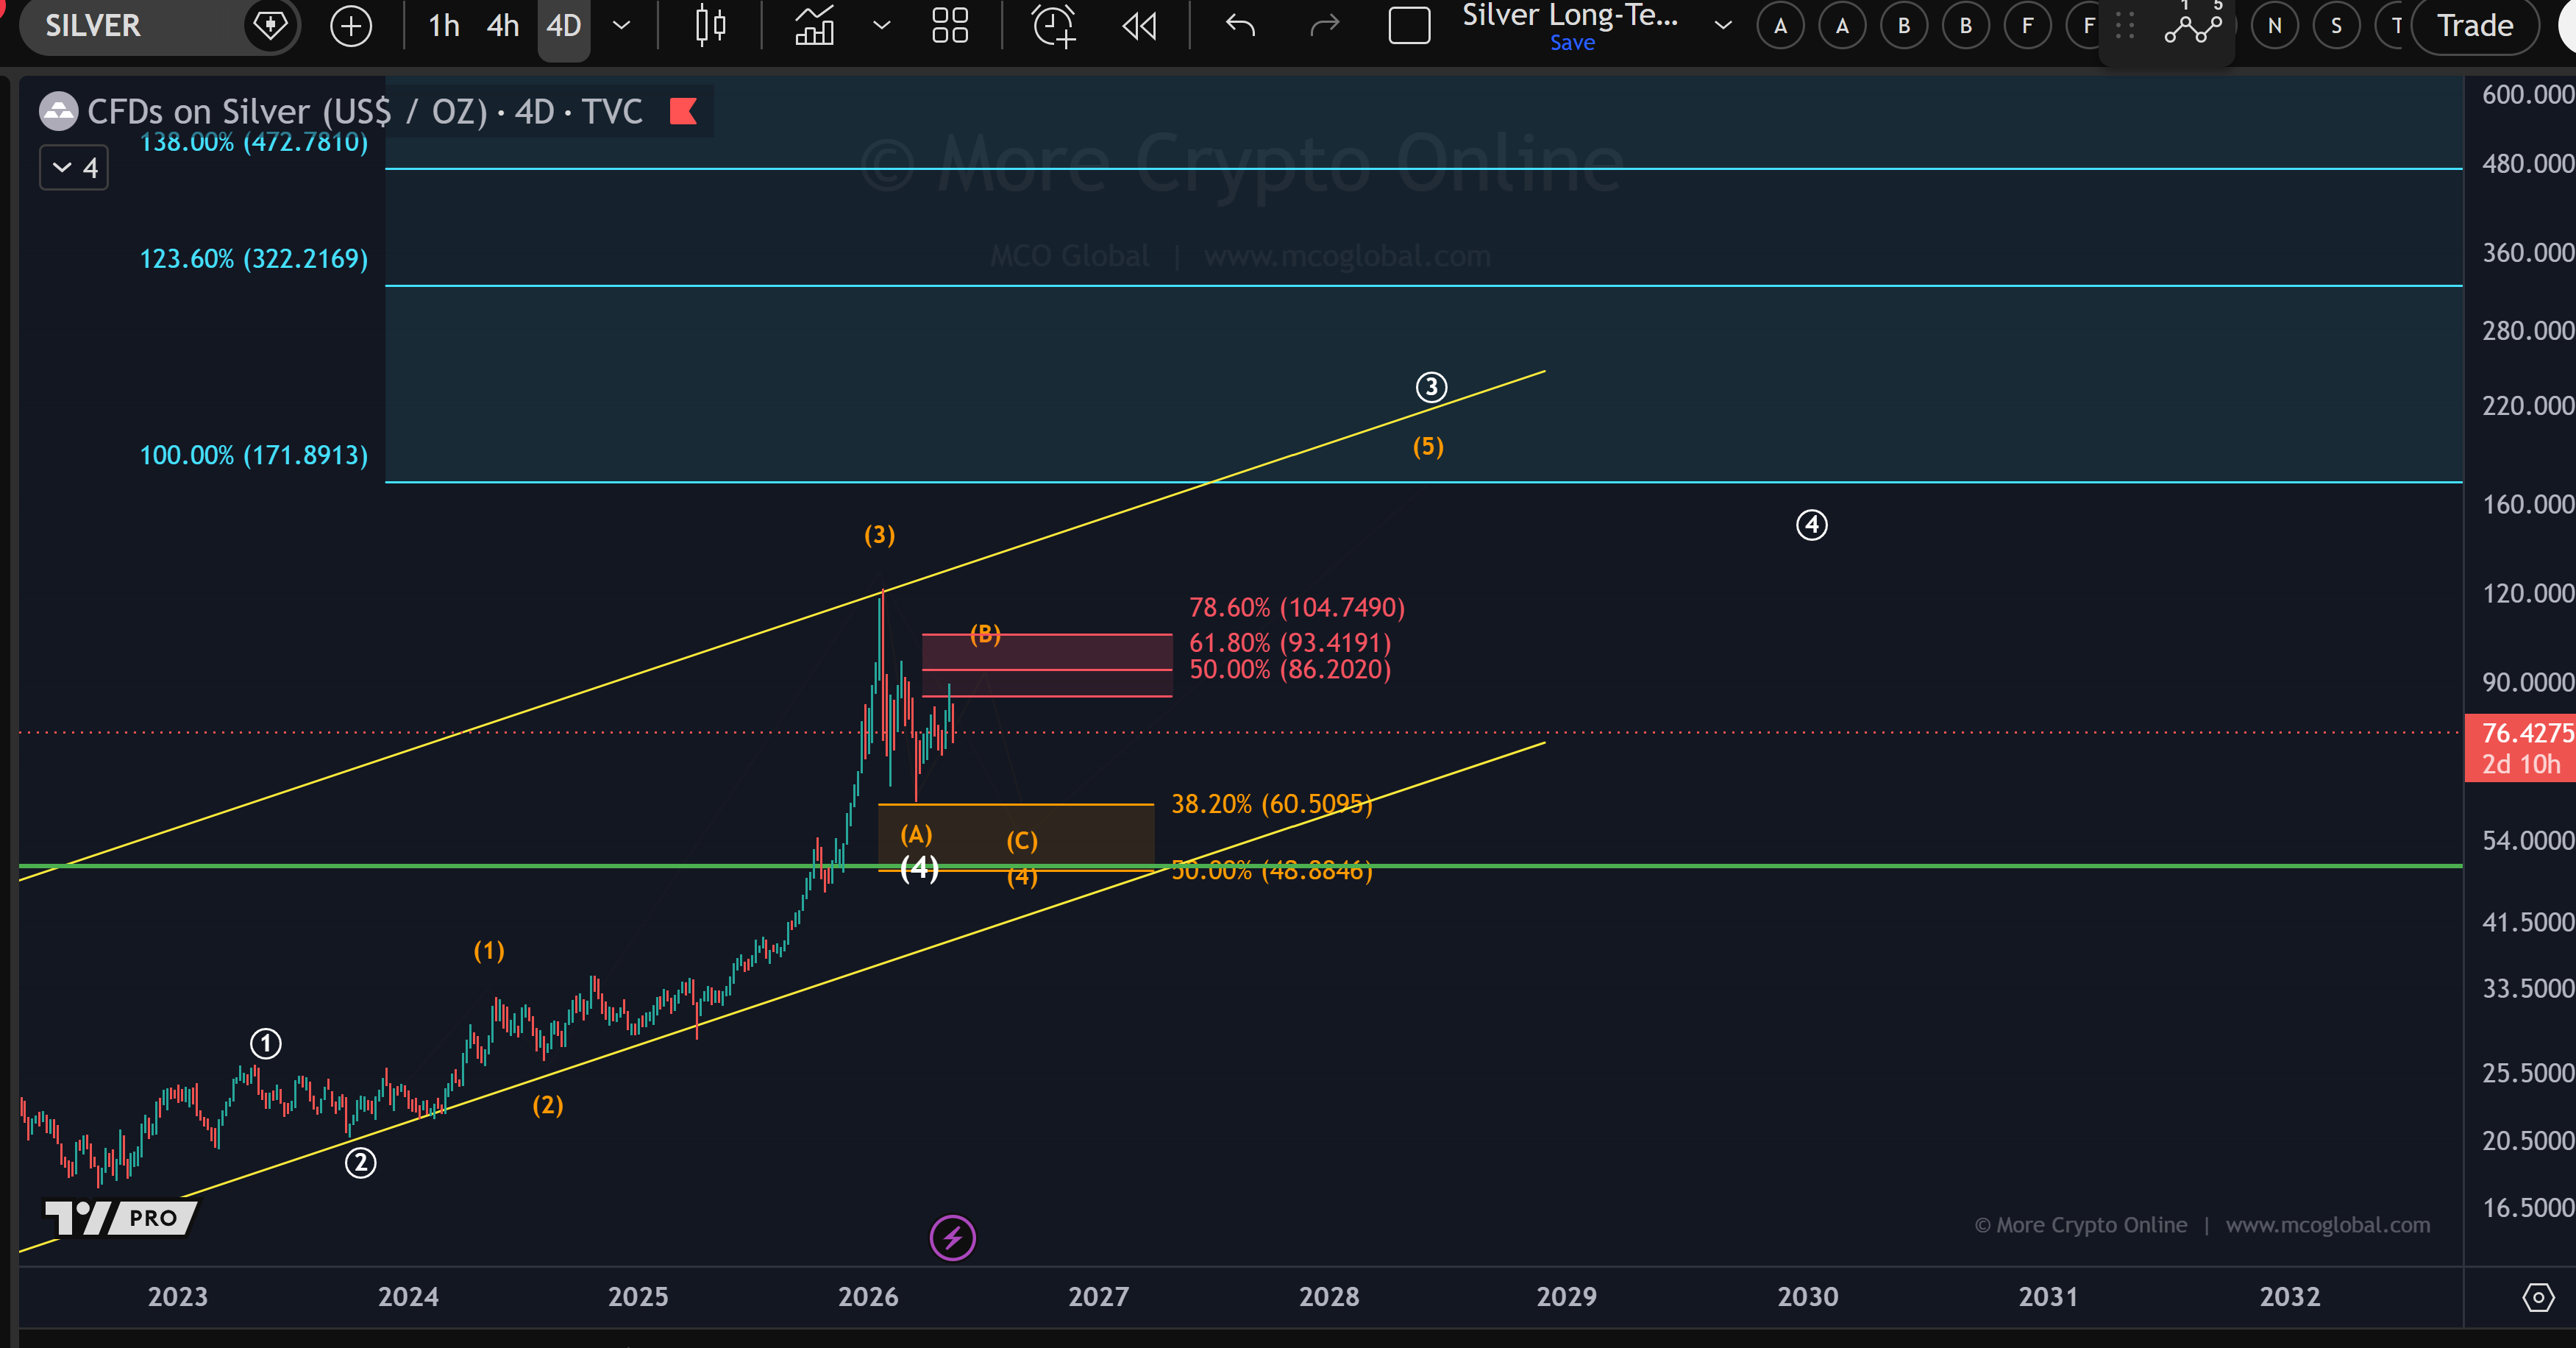
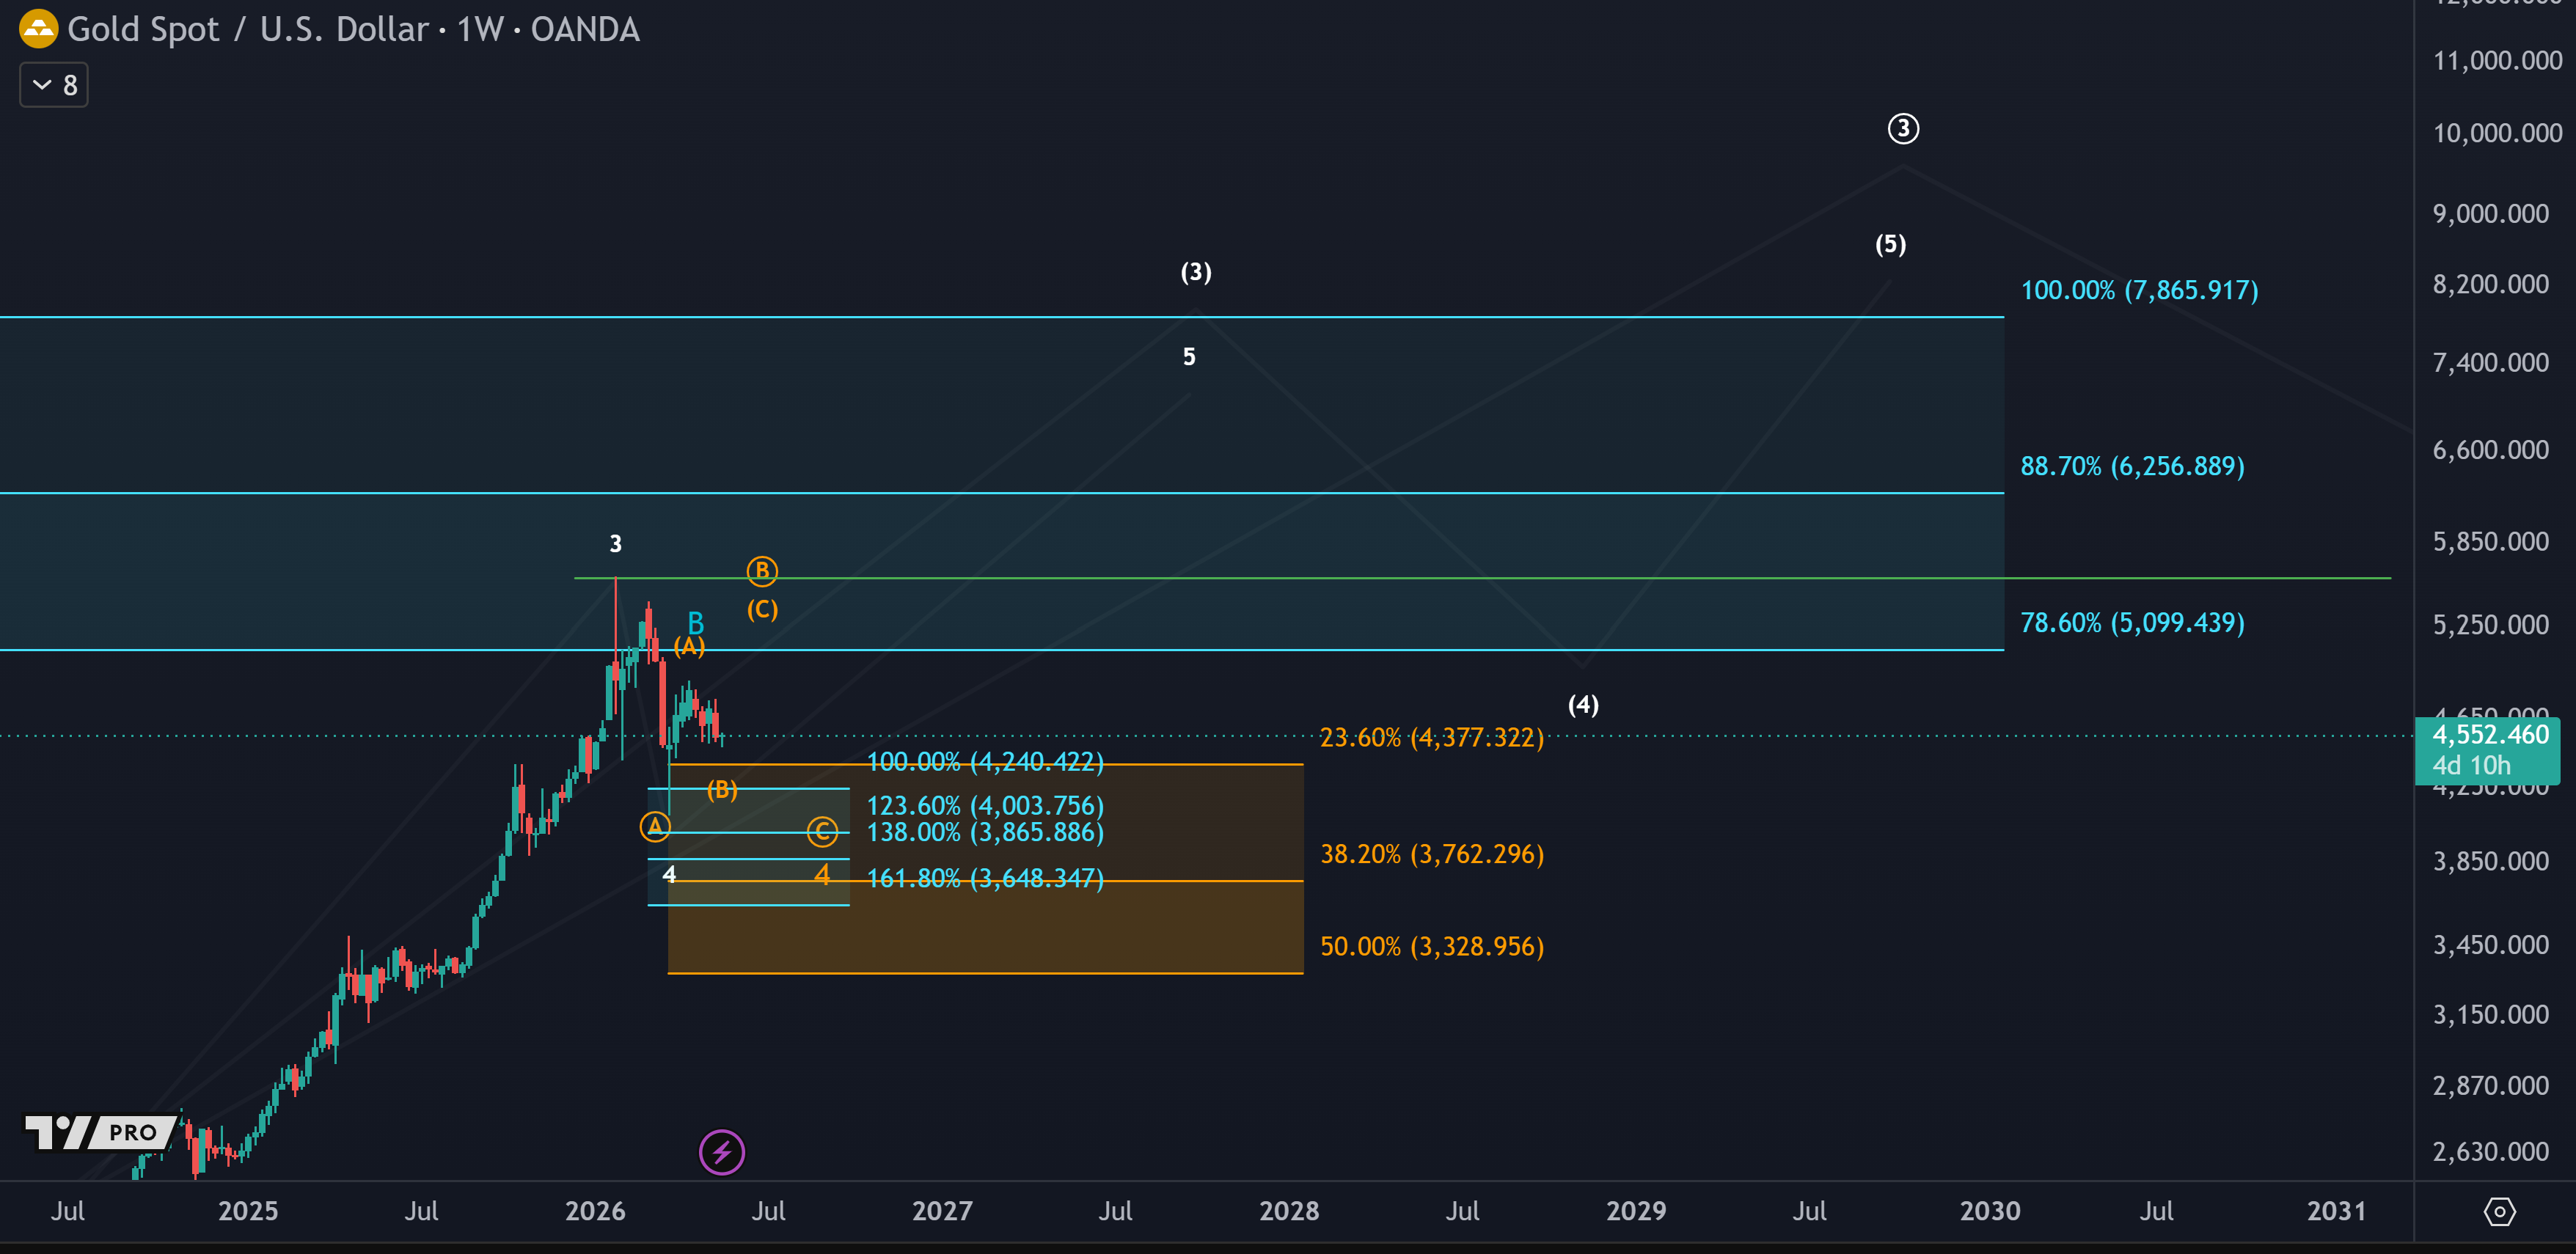
There is also a structural piece worth naming. The silver market remains in its sixth consecutive year of supply deficit, with 2026 deficit projected at 46.3 million ounces according to the Silver Institute, up 15% from 2025. Central bank gold buying continues at multi-year highs. Dedollarization remains a slow grinding tailwind. None of that supports the metals on a given Sunday-to-Monday tape, but it does set the floor in the cycle.
For the coming week, watch two specific catalysts. FOMC Minutes Wednesday from Powell's last meeting. If three dissents from last time signal more hawkish leanings inside the committee, yields keep pushing and gold takes more pain. If the minutes lean dovish, gold catches a bid fast. May CPI is the second one. Another hot print and the inflation-rates channel that is currently hurting gold gets reinforced. A soft print and the squeeze releases.
The MCO framework on precious metals has not changed. Structurally bullish longer-term given supply deficits, central bank demand, and the macro backdrop. Short-term still inside a correction phase that has further to run. The Iran wild card cuts both ways but in this regime it is hurting more than helping. Wait for the structure to finish before chasing.