

Contactless payment in a café: an illustrative photograph of payments.
PayPal has recovered from its February low, but one important piece is still missing from the chart's case for a lasting turn: another high. The video analysis dated 22 October 2026 focuses on the August peak just below $63. Clearing it could complete an advance that remains unfinished, although it would represent only the first stage of a broader confirmation process.
The timing adds interest. The company's official calendar schedules third-quarter results for 27 October 2026. The report can change expectations for PayPal. Whether it also triggers the next hoped-for advance in the share price is unknown beforehand. The levels below come from the video analysis and are not live prices.
Support has held for now
The daily chart shows the sequence clearly: the advance from the February low was followed by a pullback after the August high. The analysis identifies a three-wave advance so far. In the preferred white count, the subsequent correction could be the fourth wave, provided the market now extends the recovery again.
The relevant support zone on the original chart runs from $49.61 to $55.85. The spoken analysis simplifies its lower edge to approximately $49.60. The reaction from this area keeps the bullish possibility open. That reaction alone, however, does not complete a five-wave upward structure.
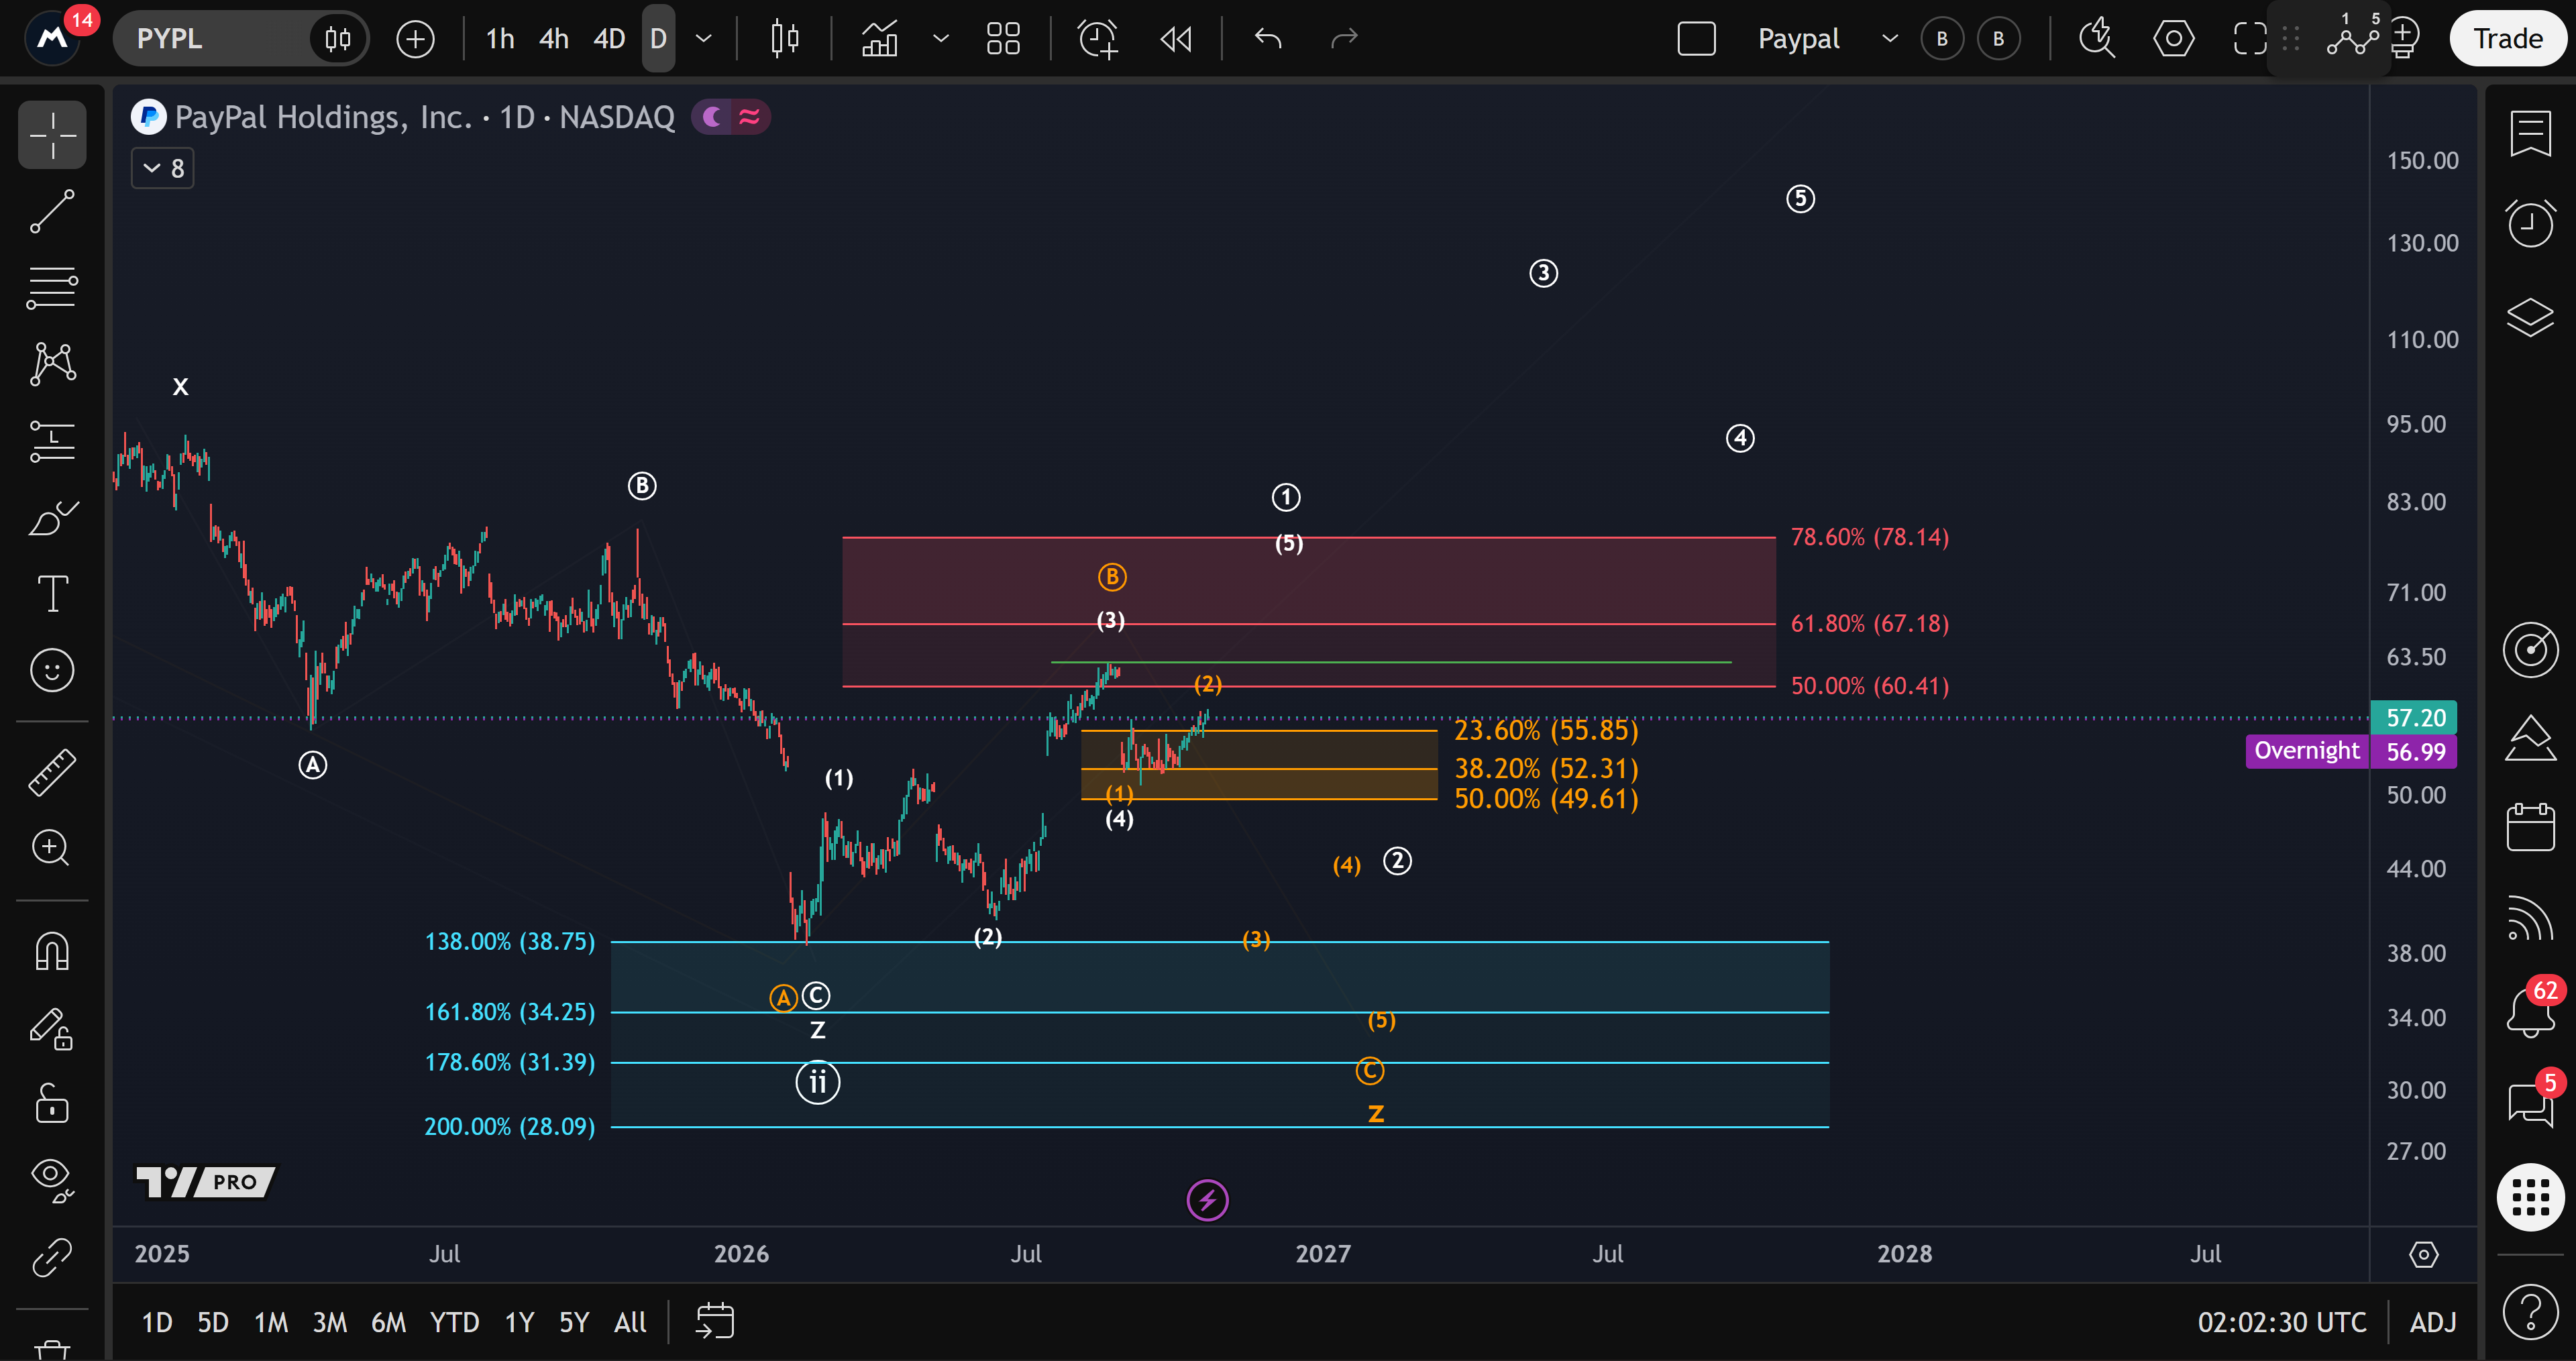
A new high above the August peak just below $63 could supply the missing fifth advance. The marked resistance levels at $67.18 and $78.14 would then warrant attention. Their presence on the chart is not a promise that price will reach them. The market must first overcome the initial hurdle.
A breakout would not finish the test
The video analysis sets a higher bar for a trend change than a single breakout. A complete five-wave advance should be followed by a three-wave pullback. A subsequent move above the high of that first advance would provide another stage of confirmation. Keeping that sequence in view avoids equating an early positive signal with an established trend.
The current scenario also has a clear downside boundary. Below approximately $49.60, the analysis would stop looking for a fifth wave within this particular pattern. The orange alternative of a merely intermediate recovery would gain relevance, and fresh lows would remain possible. That boundary applies to the nearer-term pattern; it is not the invalidation level for the entire long-term count.
The long decline remains the backdrop
The four-day chart illustrates the distance that can separate a recovery from a complete change in trend. PayPal has been in an extended correction since 2021. The reaction from around $39 in February provides the starting point for the current bottoming hypothesis. Whether it develops into a new upward trend is something subsequent price action still needs to demonstrate.
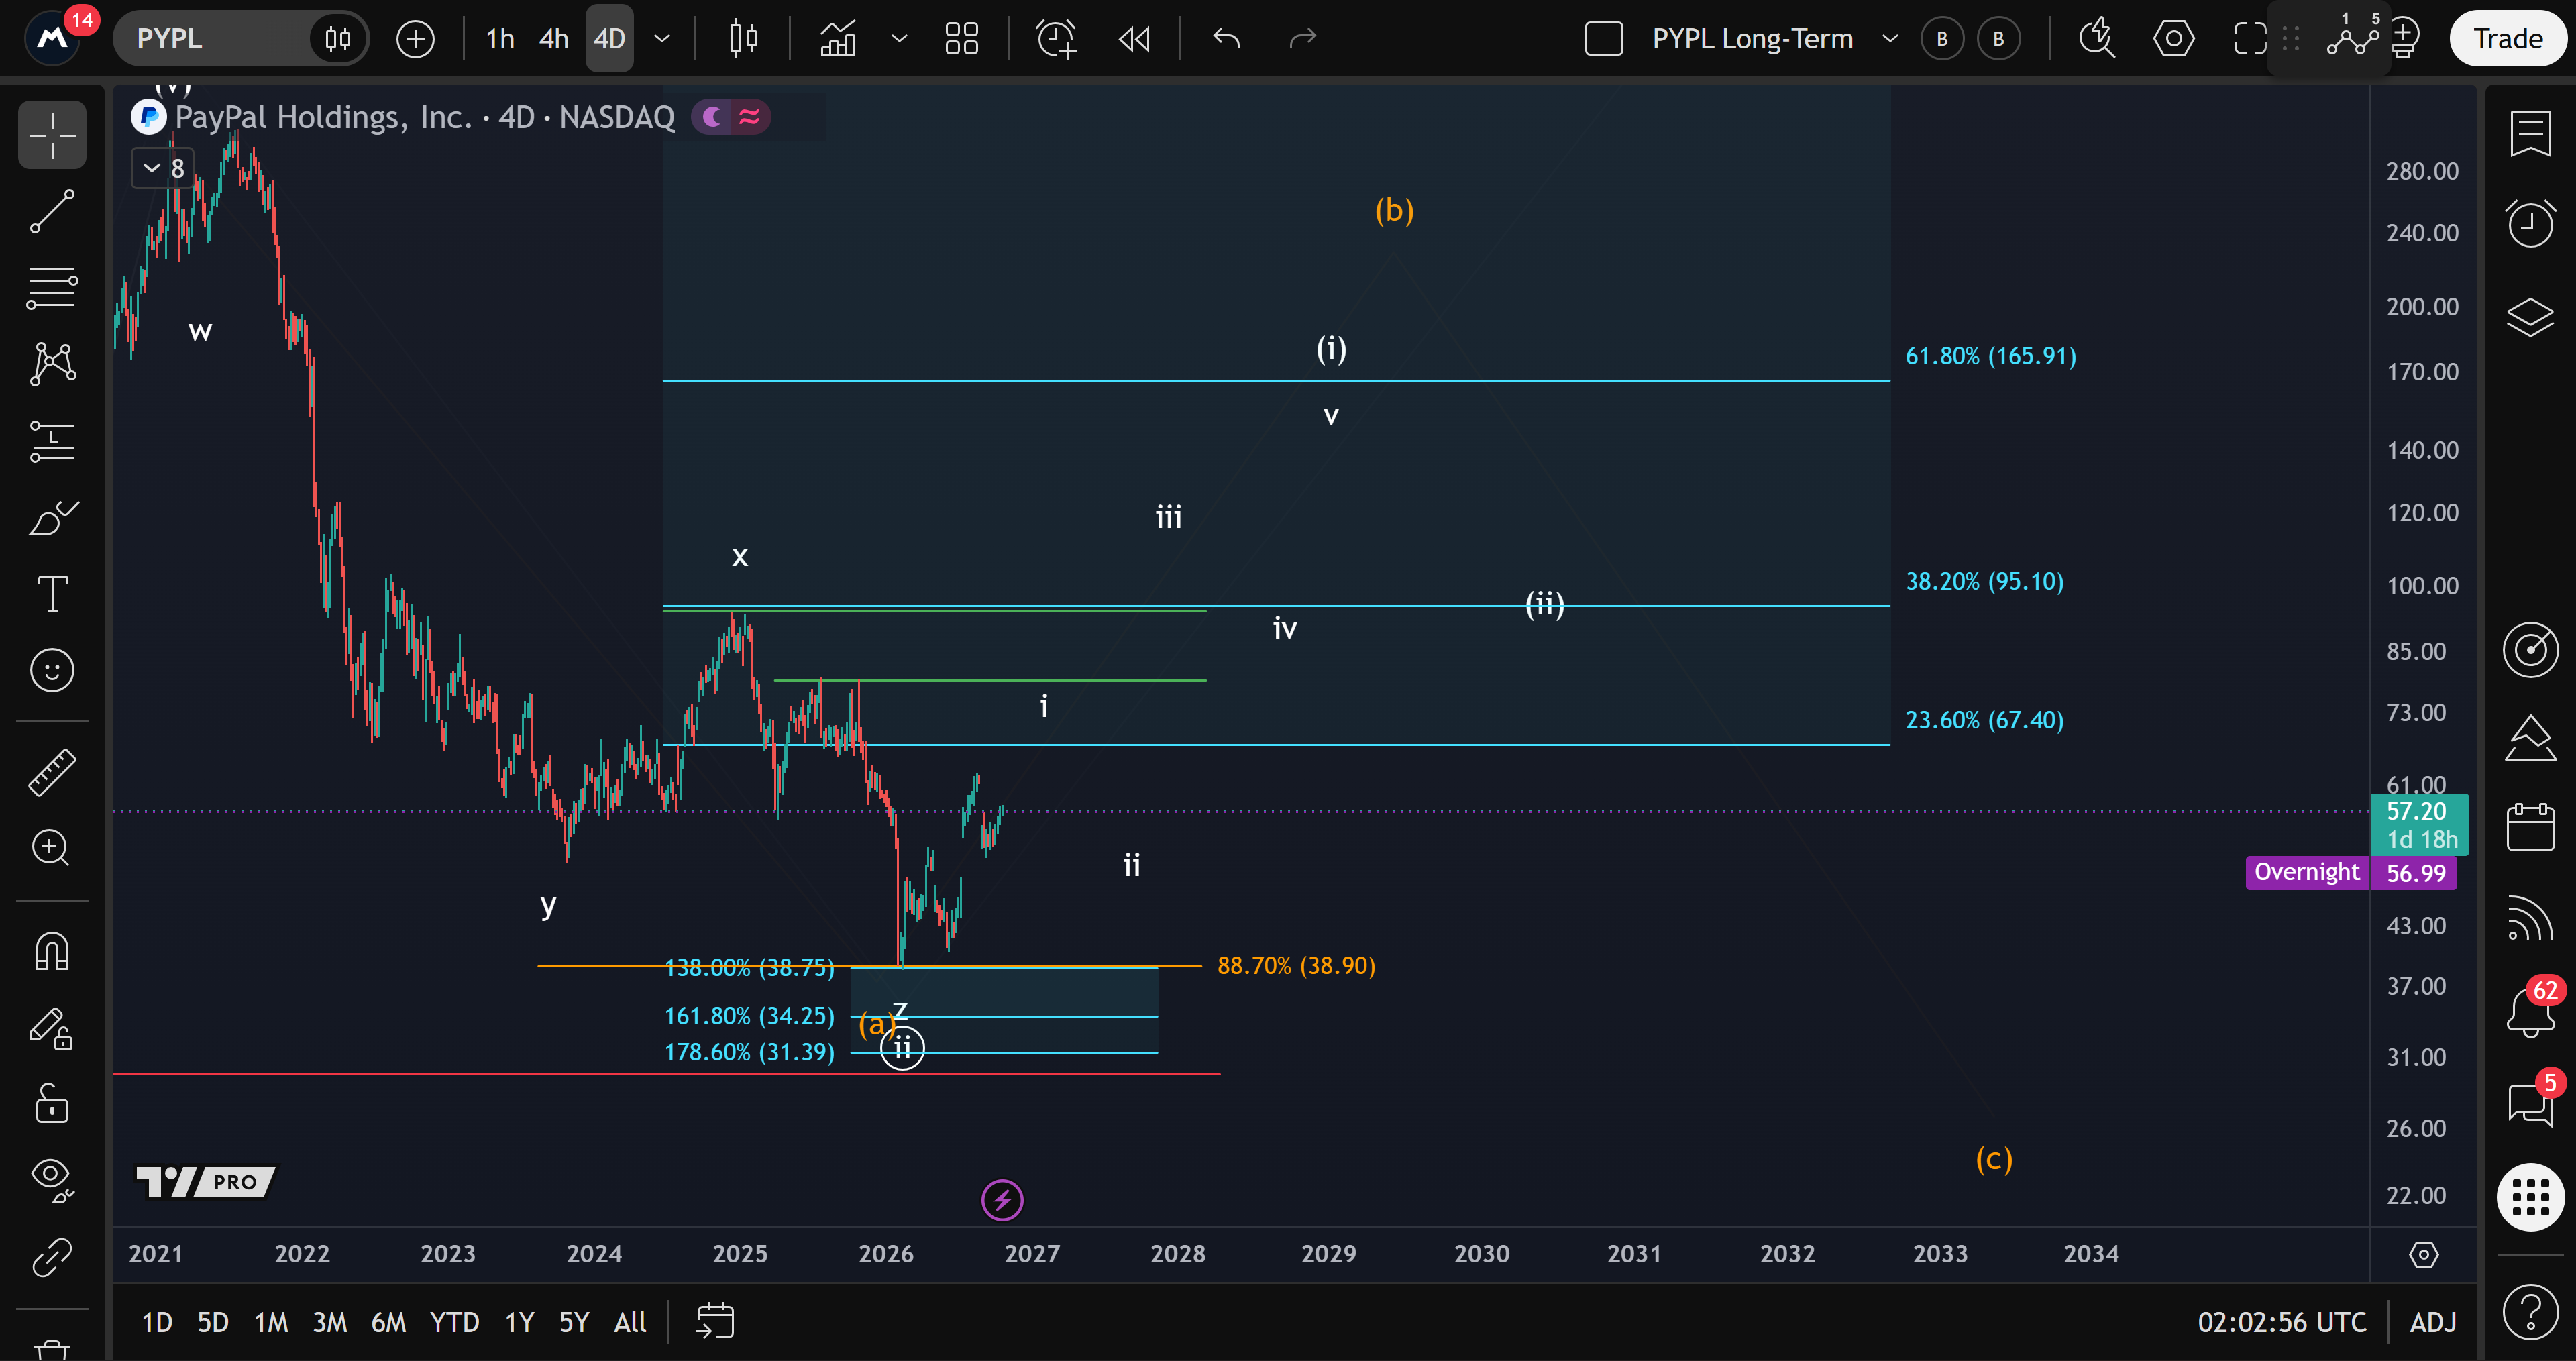
Wave paths drawn far to the right illustrate the competing possibilities. They are not calendar forecasts. They neither establish a fixed date for a later high nor guarantee that the white scenario will prevail over the orange alternative.
What the results still need to clarify
PayPal reported 439 million active accounts in the second quarter of 2026, up 0.3% year on year. That metric counts accounts rather than individual customers.
The coming report therefore raises the question of whether the company can deliver more convincing growth signals and a sustainable outlook. The video analysis cautions against answering that question with an apparently low valuation alone. Repurchases can support earnings per share without a matching improvement in underlying business performance. The share price need not respond immediately with a lasting advance.
The report and the chart consequently answer different questions. New financial results can change the assessment of the business; the price structure shows whether buyers translate that assessment into a continuing advance. Both remain unresolved ahead of the release. The immediate task is to watch whether PayPal can clear the August high without first losing the support that underpins its current scenario.