

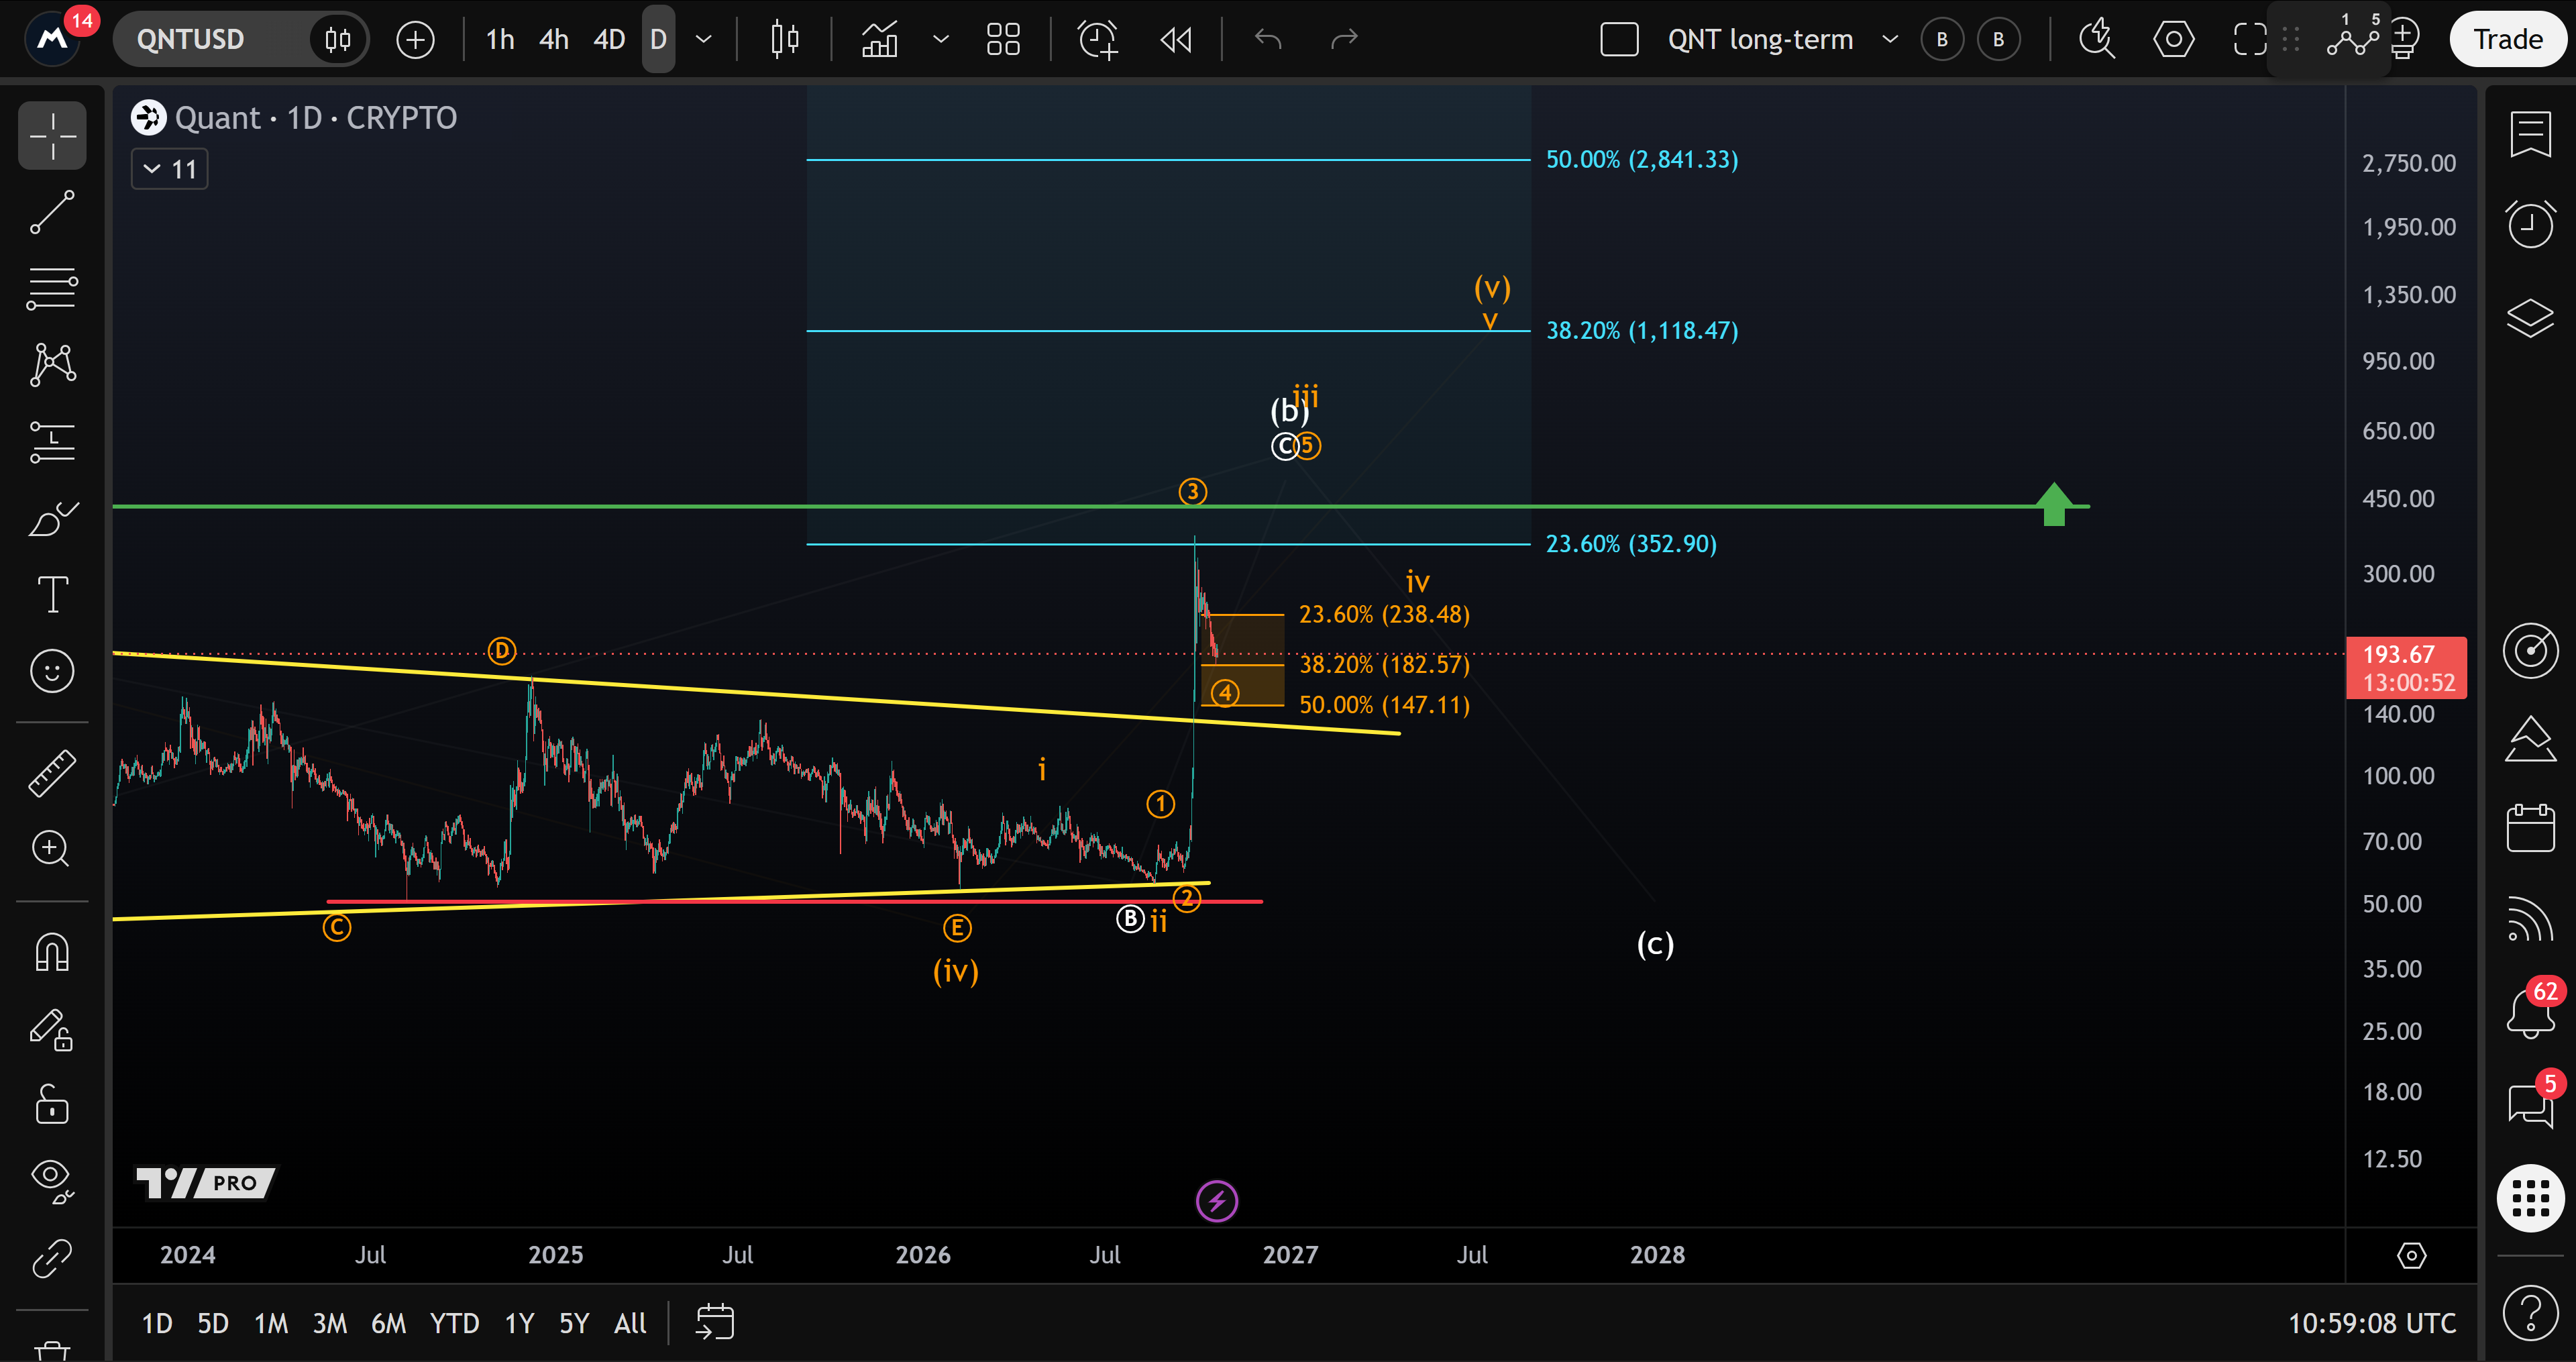
Quant has lost almost half its value from the roughly $370 high highlighted in MCO’s video analysis of 20 October 2026. The decline has brought a crucial support area near $183 into focus. The latest accompanying charts show QNT around $194, but the distance from the high is not, by itself, evidence that a bottom has formed. The question is whether buyers can turn support into a convincing recovery.
The September breakout is under pressure
For years, Quant moved sideways without establishing a clear trend. September’s break above an old descending trendline offered a possible change in that pattern. The sharp retreat since then has made the quality of that breakout an open question: can the market hold its ground and resume the advance, or will the correction deepen?
On the daily chart, the $182.57 level is the 38.2% Fibonacci retracement of the preceding rise. MCO’s orange Elliott-wave count treats the decline as a possible fourth wave within a larger five-wave advance. Under that interpretation, support could provide the base for a fifth wave and another high. That remains a conditional reading of the chart, not a confirmed turning point.
Why a bottom is not yet confirmed
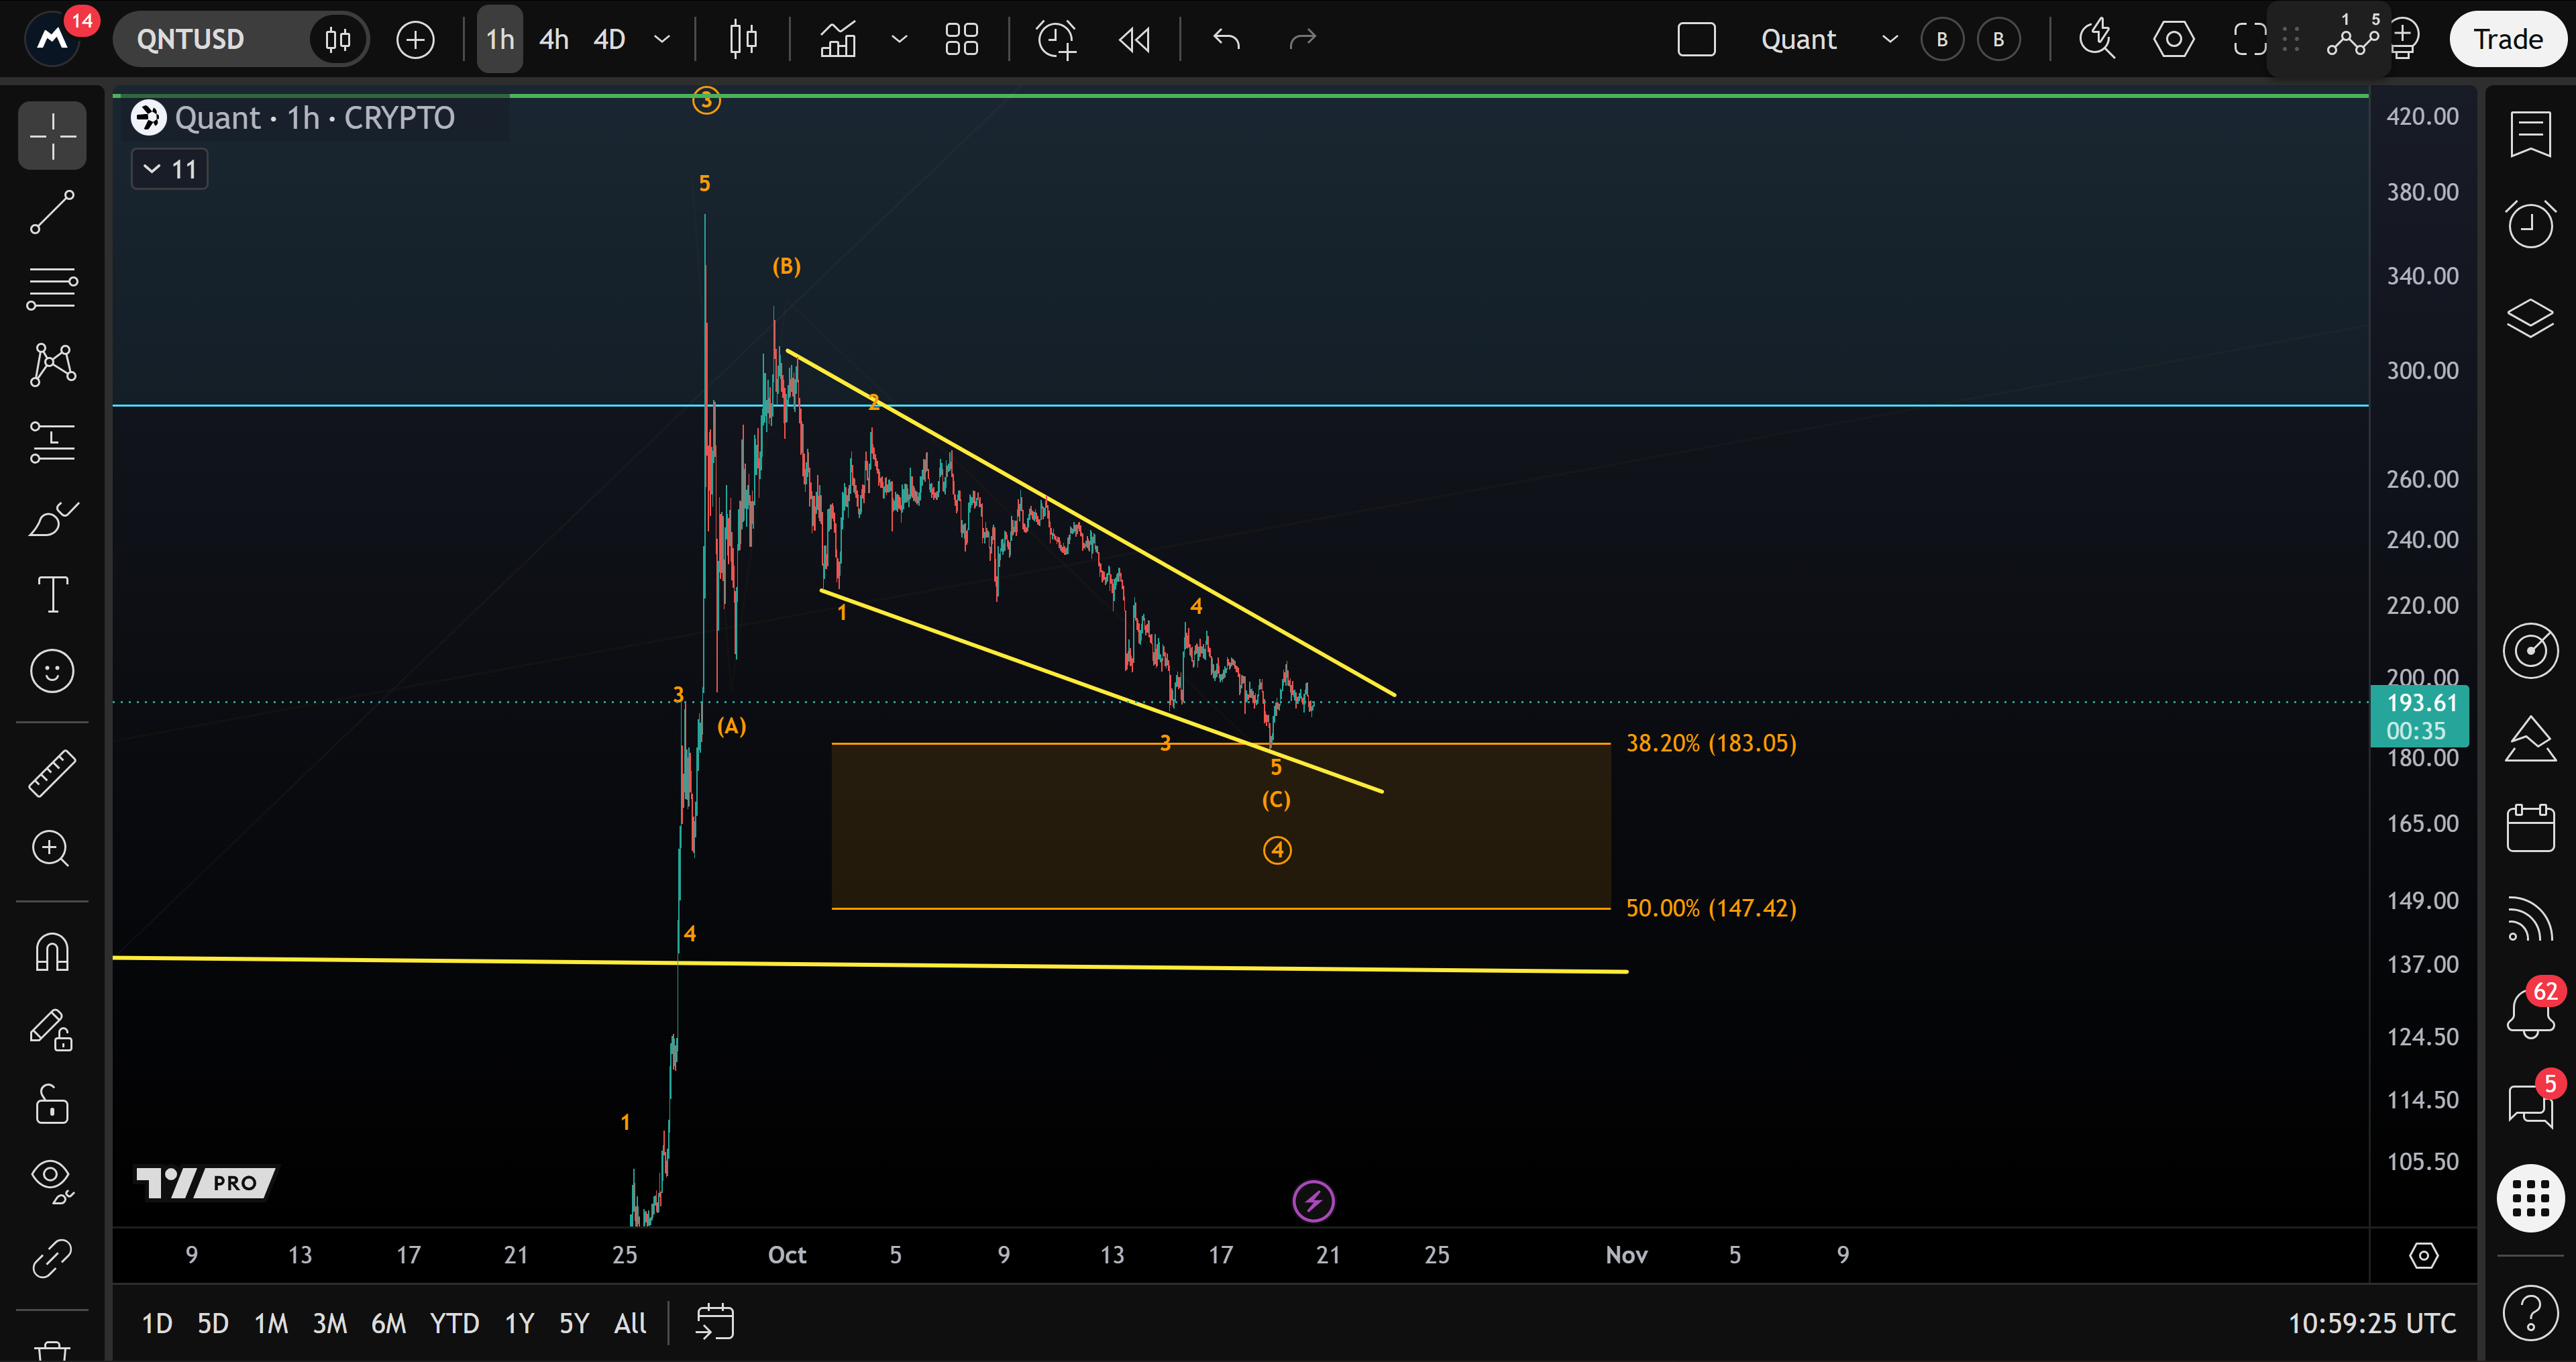
The hourly view puts the recent selling inside a descending channel. MCO interprets the move from September’s high as an A–B–C correction: an initial decline, an intervening rebound and a further leg lower. Wave C has moved below the low of wave A, a development the analysis had been looking for within that structure.
This chart places the nearby Fibonacci support at $183.05. It sits close to the daily level, reinforcing the significance of the $183 area. Yet an identifiable corrective pattern does not establish that selling has finished. The video explicitly leaves room for the correction to become more complex before a durable upward move develops.
What would make a recovery more convincing?
The earliest sign of a possible local low would be a break above the upper yellow boundary of the descending channel. Beyond that initial signal, MCO is looking for an impulsive rise with a recognisable five-wave structure. Such a move would strengthen the case that the market is beginning the next upward leg.
The distinction matters because a sharp bounce can also occur inside an unfinished correction. At the time of the analysis, there was still no convincing upward reaction. Holding a Fibonacci level and producing evidence of renewed buying are separate tests; the orange scenario needs both.
The level that would undermine the fourth-wave reading
Below $147.42, MCO considers the decline too deep for its fourth-wave scenario. The older daily trendline lies beneath that area and could still provide some support, but a reaction there would not, on its own, repair the current wave interpretation.
If buyers do regain control, the analysis identifies resistance around $360 and $430. These are potential obstacles along an upward path, not assured price targets. Quant’s large swings make the sequence more important than the distant numbers: first defend support, then escape the declining channel and demonstrate an impulsive advance. Until that evidence appears, the $183 area marks a test the market still has to pass.