

The long advance in US equities may be entering a late stage, but a mature cycle is not the same as a confirmed market top. In his video analysis of 20 October, MCO analyst Ben sets out a conditional view of the Dow Jones and S&P 500: a substantial correction could still be followed by another high before the larger bull-market phase is complete.
The monthly and weekly charts help separate those possibilities. They describe the structure of a long-running advance, rather than a timetable for its end. All four charts below were captured on 20 October 2026 and reflect market data through the close on 19 October.
Dow Jones monthly: a late stage within a larger cycle
Ben's Elliott-wave interpretation places the advance since 1932 within a large third wave. That advance contains five smaller waves, with the fifth now well developed. Once this large third wave is complete, his framework calls for a larger fourth-wave correction, followed eventually by a large fifth wave higher.
The distinction between these wave degrees matters. The final part of one advance does not mean the end of all future stock-market gains. Equally, a correction within that final part need not be the large correction that follows the completion of the whole third wave.
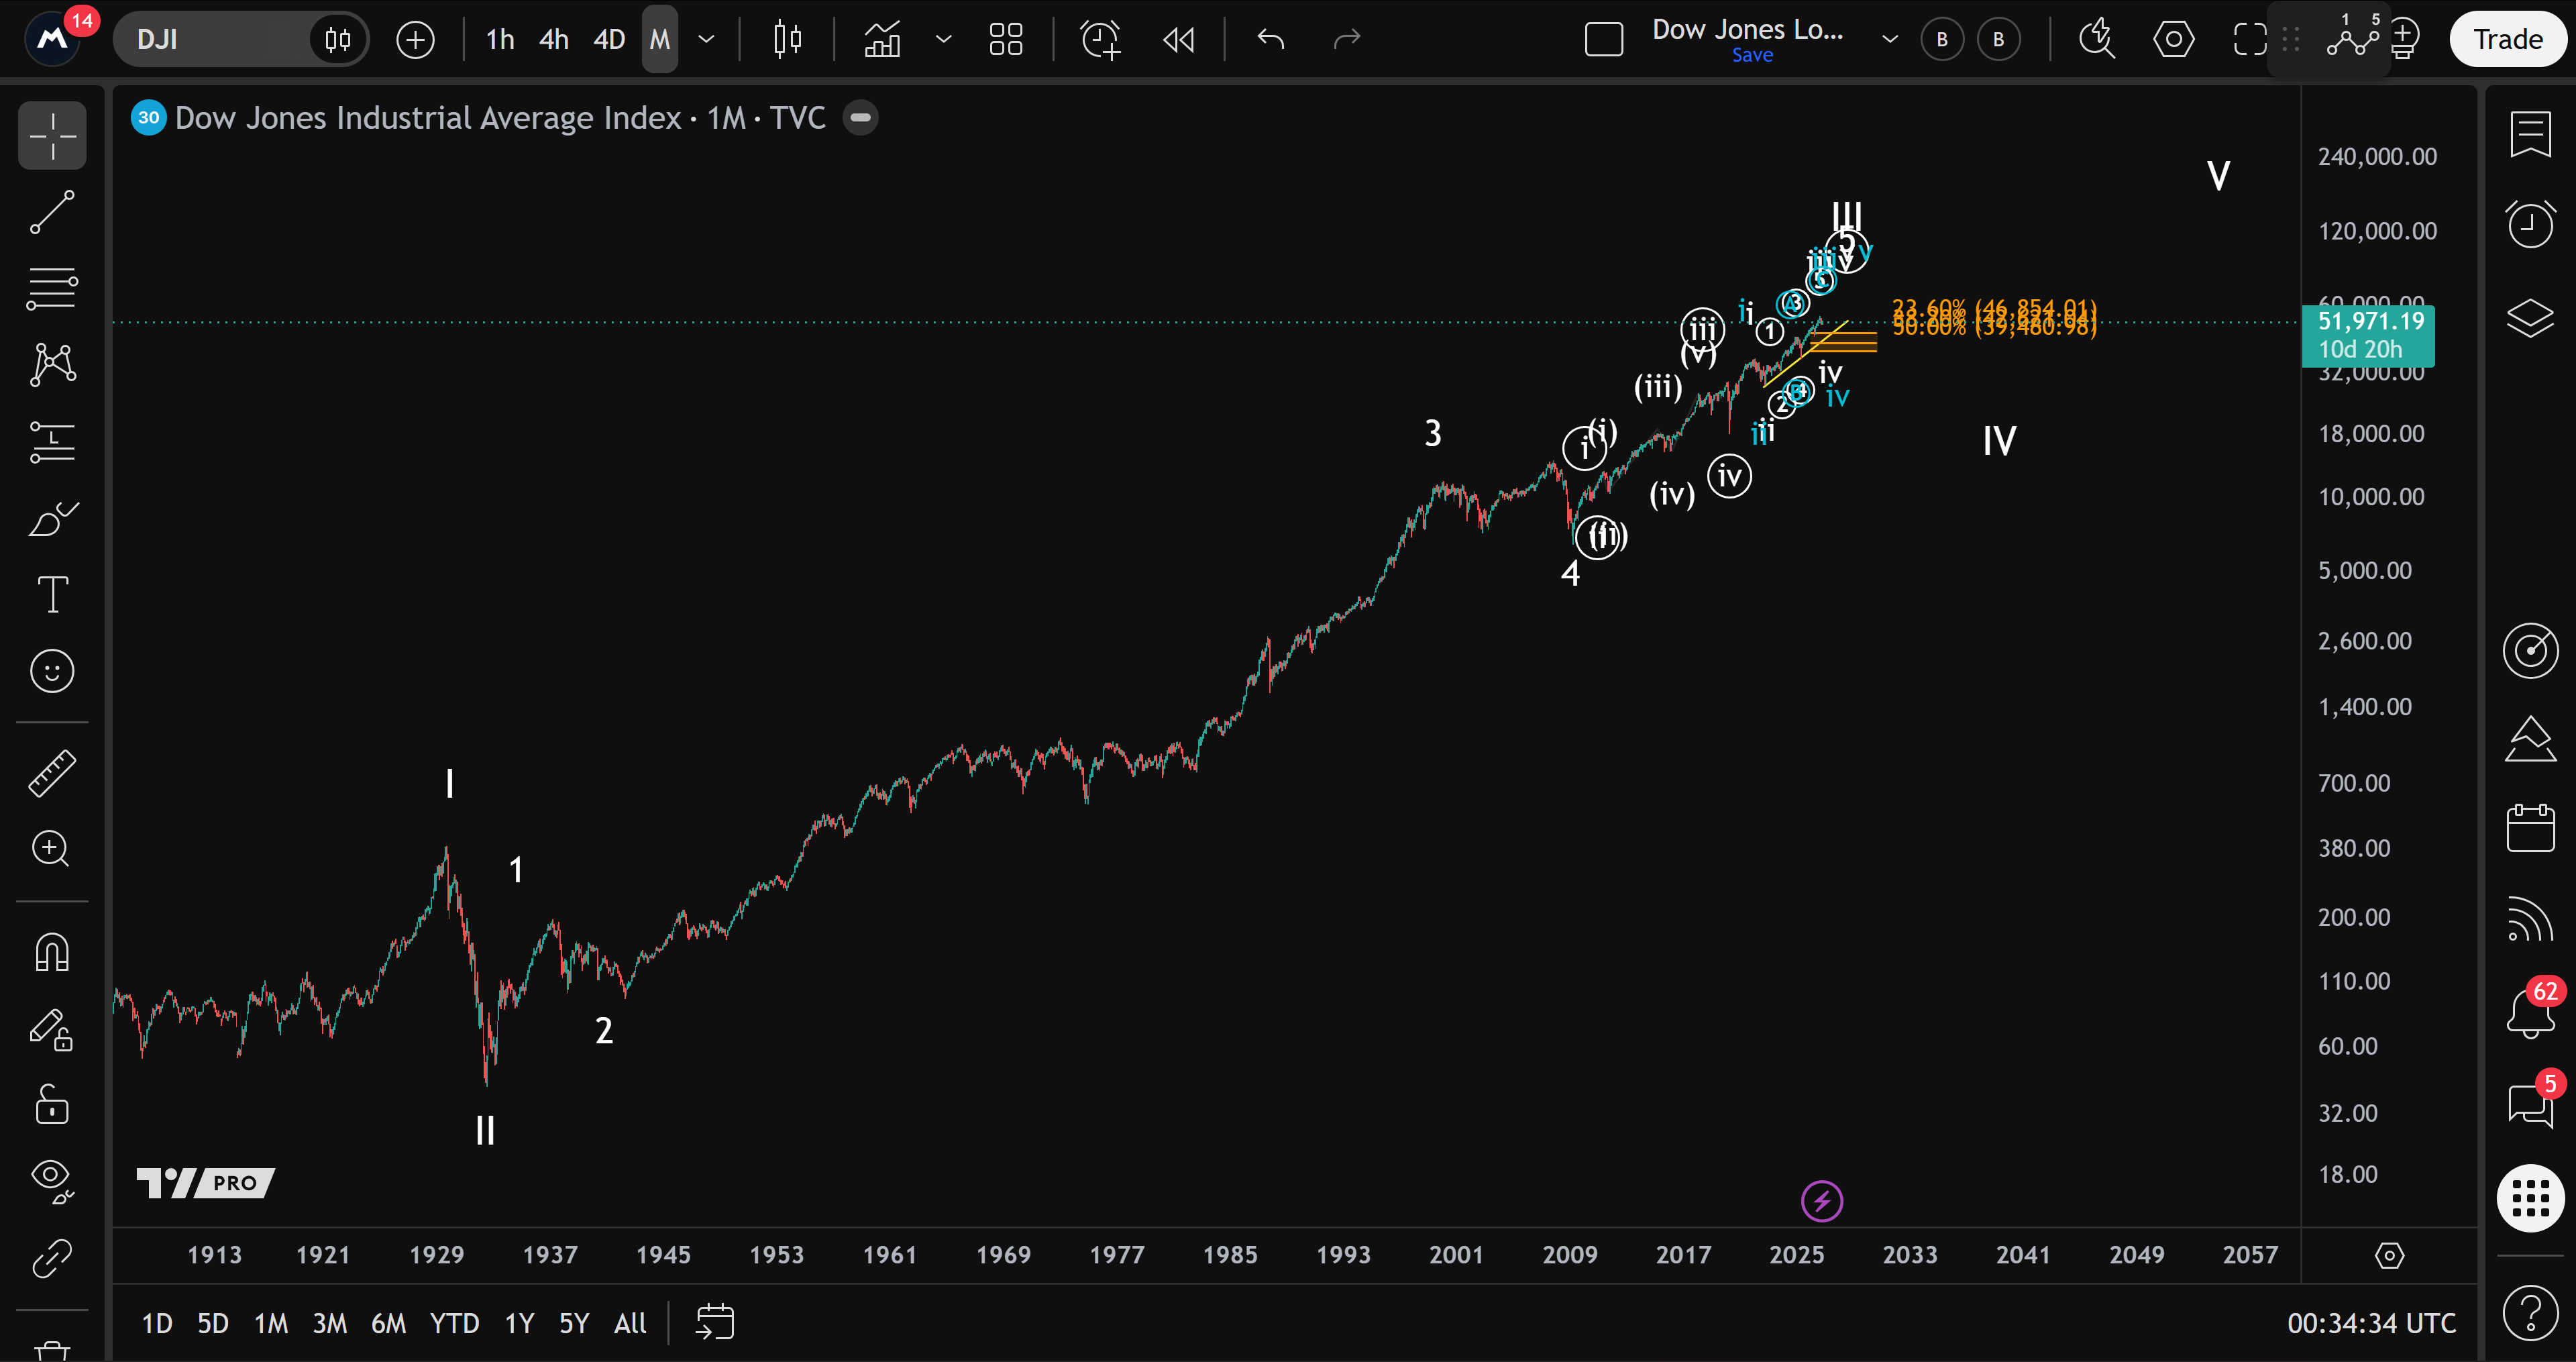
On a monthly chart, the useful question is where the market sits within that structure. It cannot establish the day, week or month of a turning point. The future positions of the projected wave labels should therefore not be read as calendar targets.
Dow Jones weekly: a correction can leave room for another high
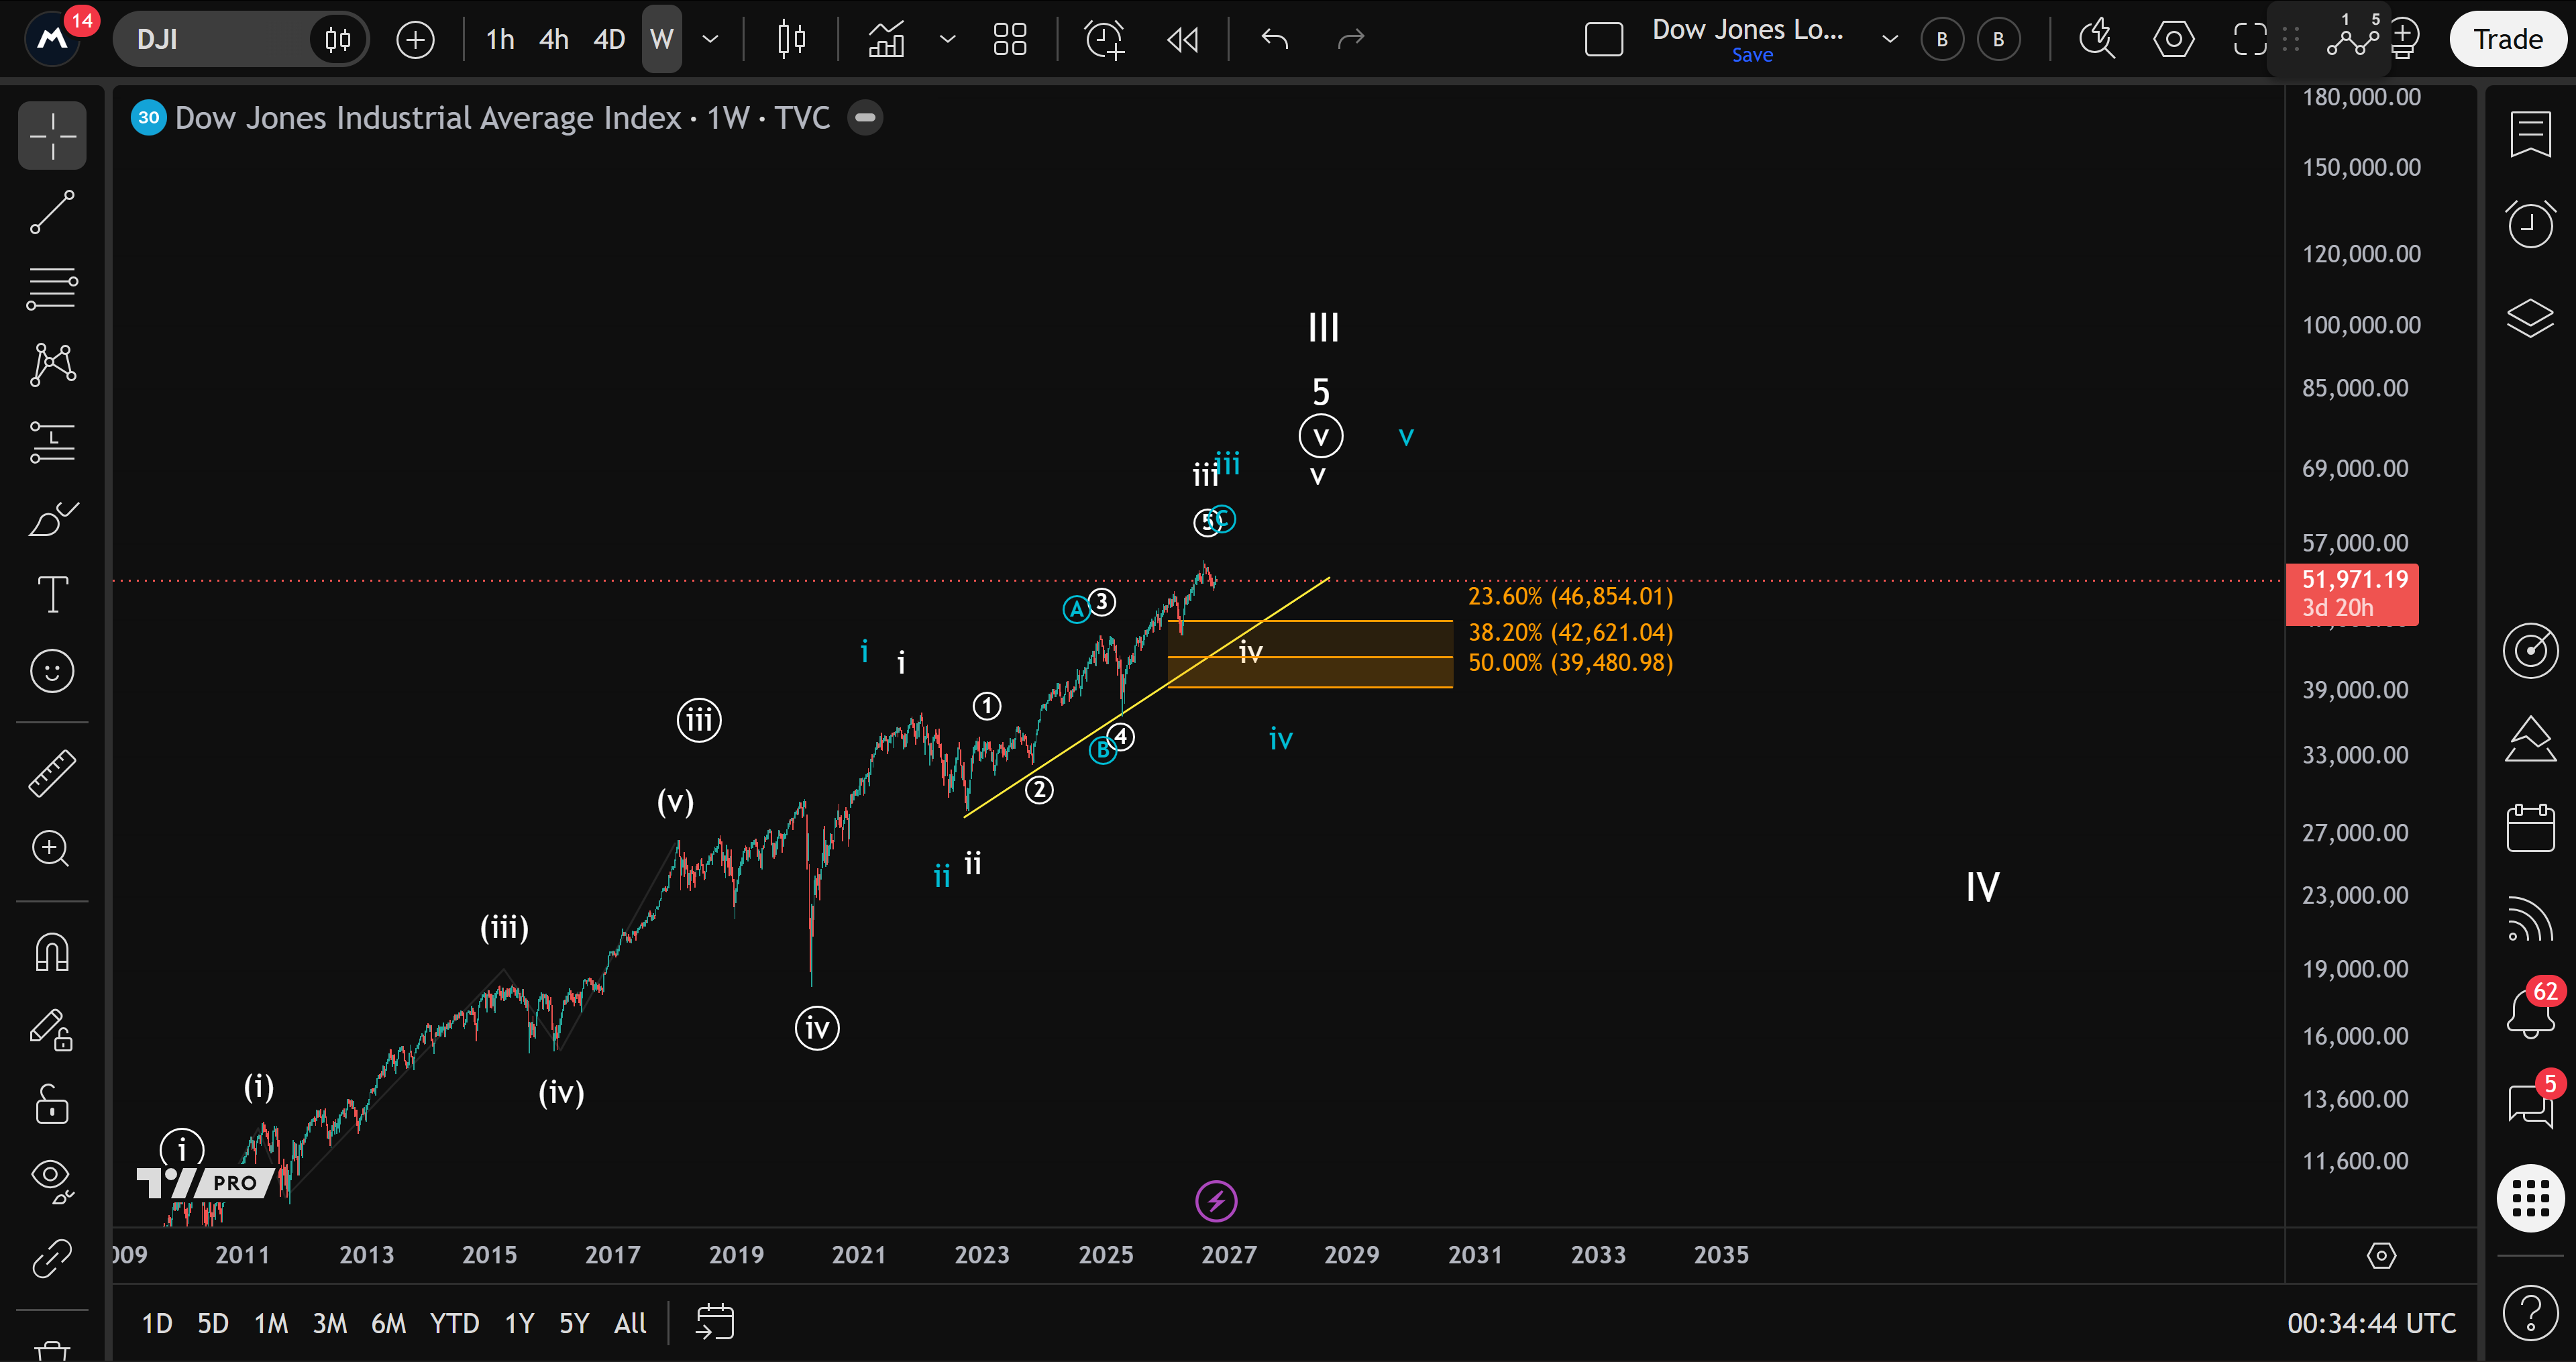
The weekly view shows why Ben still considers a further high possible. Within the fifth part of the larger advance, he sees a smaller third wave nearing completion. A smaller fourth-wave pullback could then produce a higher low, followed by another upward leg.
His first support zone for that correction is approximately 39,480 to 46,850 points. It is a broad area on a high-timeframe chart, not a precise entry level. Ben explicitly describes it as the first support zone: falling through it would make the outlook more difficult, but would not by itself settle every larger scenario.
S&P 500 monthly: keeping both long-term paths open
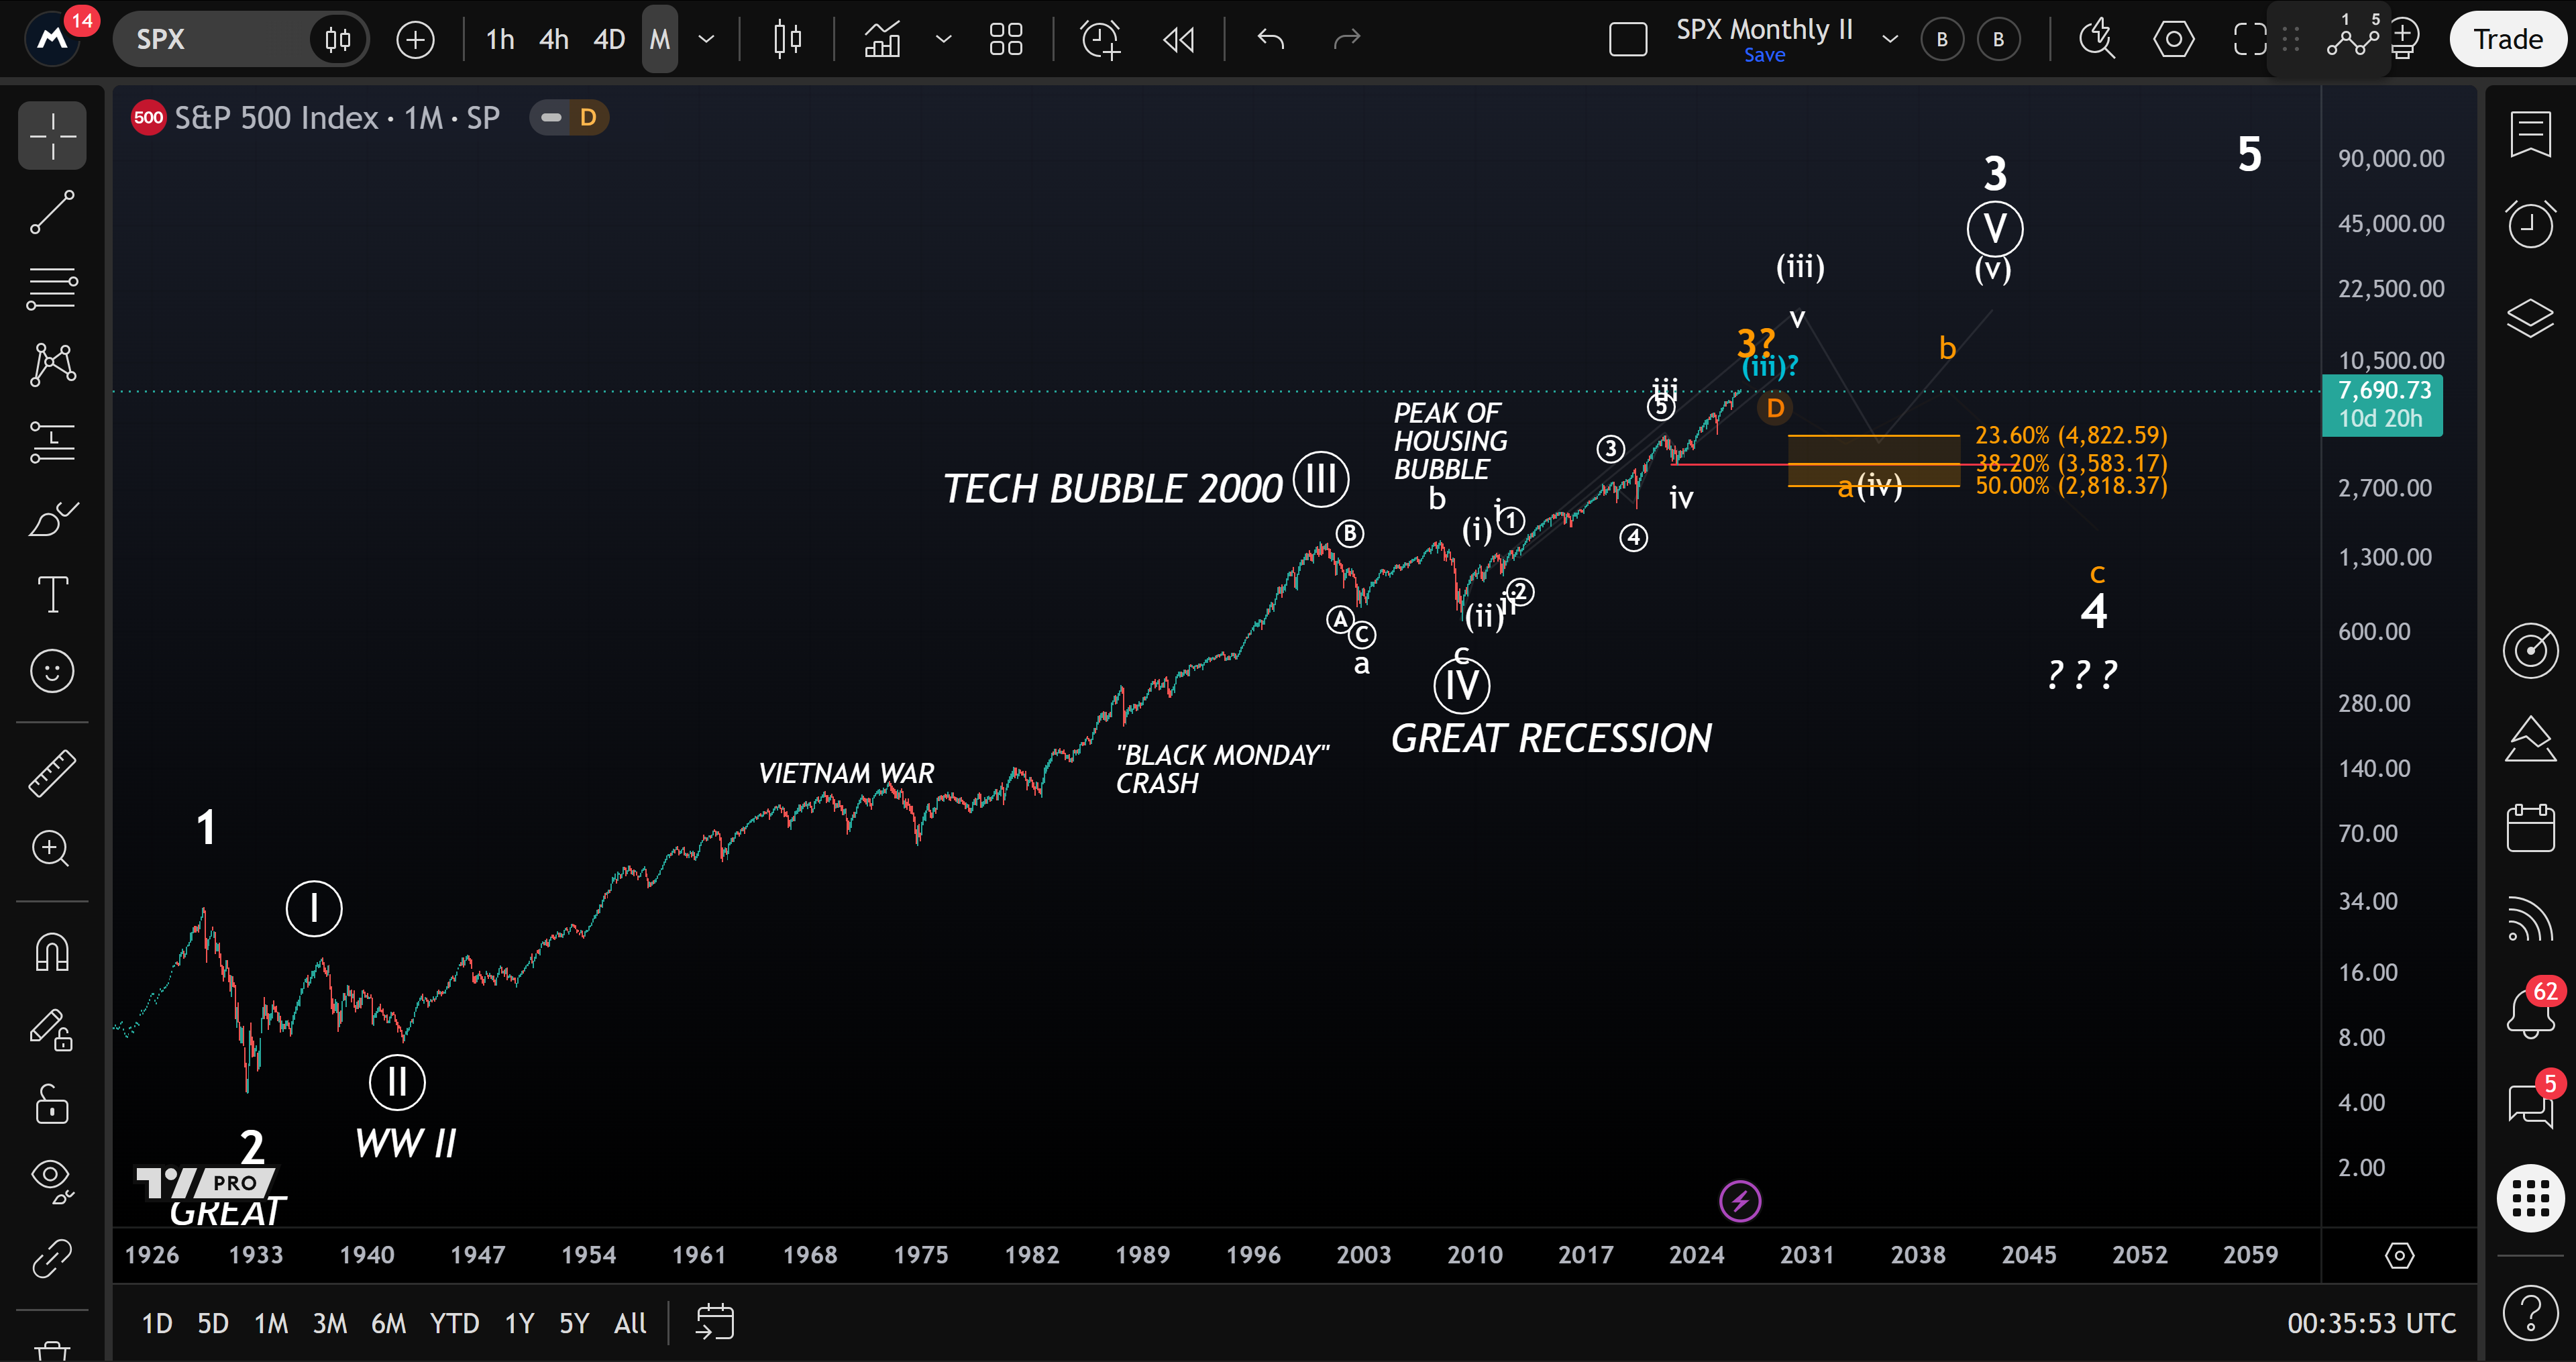
The S&P 500 monthly chart presents the same central issue: how much of the larger advance remains? The chart includes an extended path that allows another upward leg and an alternative in which a larger corrective sequence develops sooner.
The shaded area around 2,818 to 4,823 points belongs to that long-term correction map. It is a conditional support area, not a forecast that the index must fall there now. In the chart's different counts, the box is associated with a smaller fourth wave or an initial corrective leg. The alternative larger correction also extends below it, so the box should not be treated as the guaranteed endpoint of the entire bear-market scenario.
S&P 500 weekly: the warning level before the distant scenarios
On the weekly view, Ben notes how far the index has advanced since the October 2022 low. Here, too, the next correction could be a fourth wave before another fifth-wave advance. A significant decline and a subsequent new high can therefore coexist within his main interpretation.
In the video's broader discussion, he identifies the March low near 6,313 points as an important earlier warning level. A break would strengthen the case for a larger top. He expressly stops short of calling it a guarantee. This nearer reference level serves a different purpose from the much lower support box on the long-term charts.
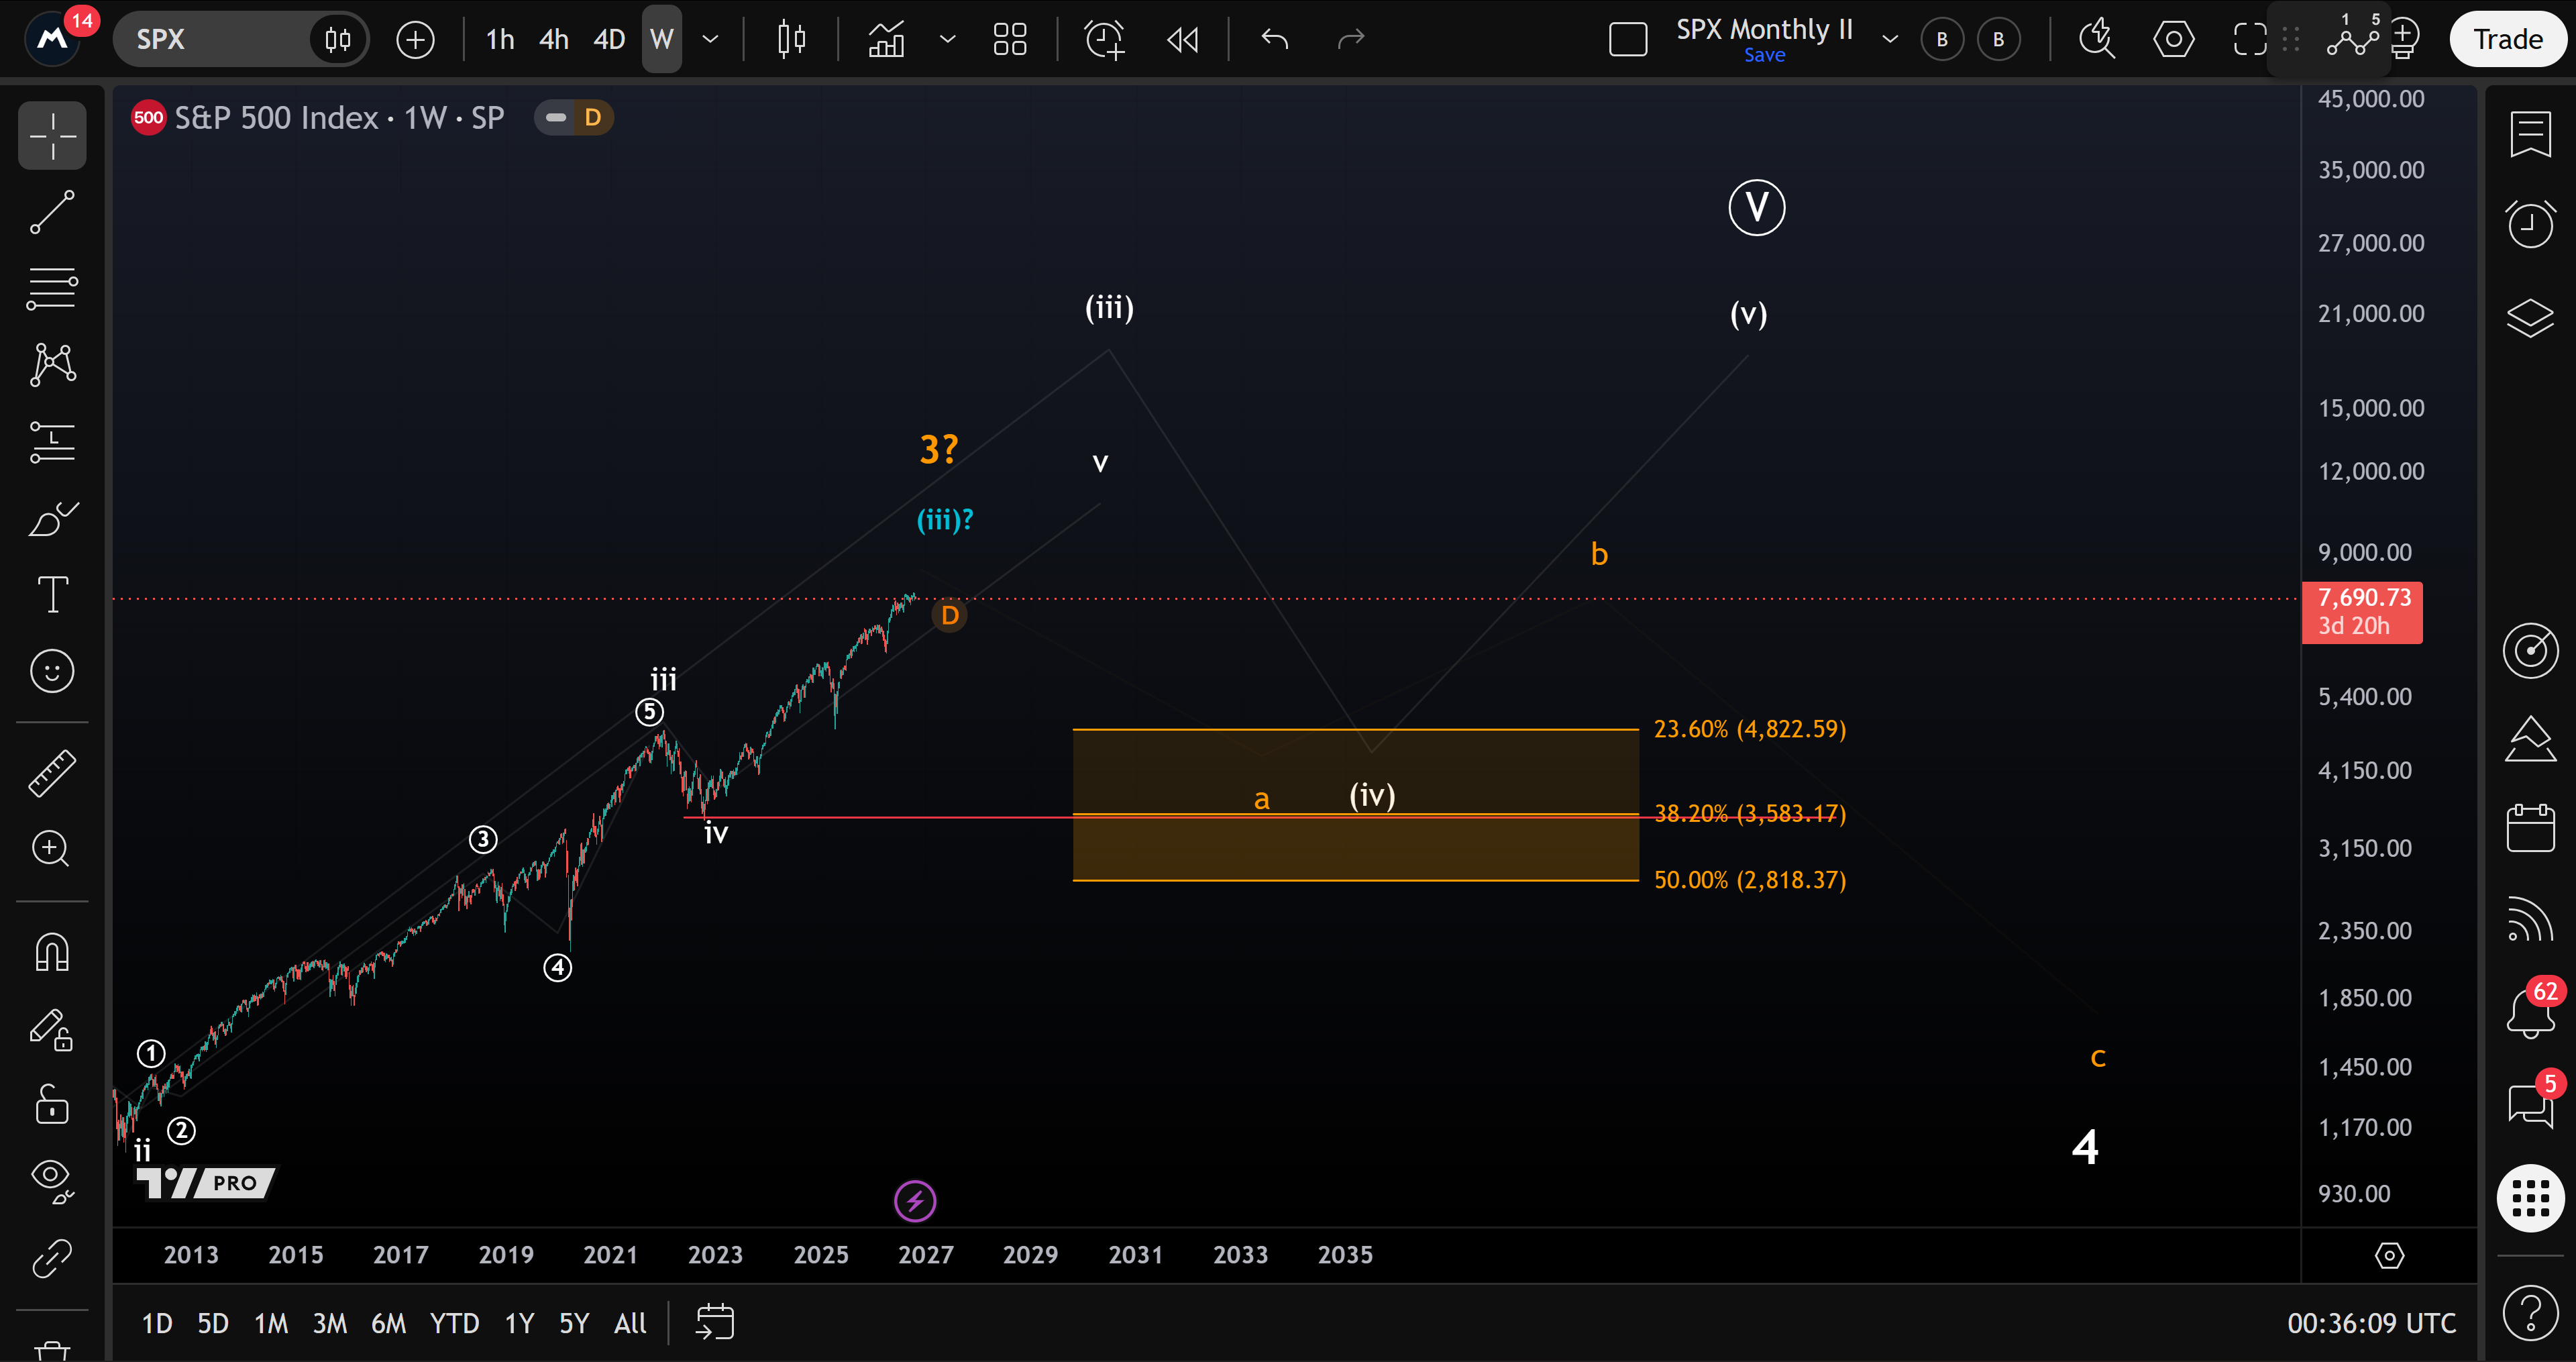
Ben's main scenario still allows one more high, while acknowledging that the larger top could already be forming. Confirmation has to come from the price structure and breaks of relevant support. The monthly charts establish the scale of the risk; the weekly charts help distinguish a correction within the advance from a possible change in the larger trend.
Based on Ben's video analysis, “155 Jahre Börse: Steht der große Bullenmarkt vor dem Ende?”, recorded 20 October 2026. This article covers only the monthly and weekly index views. The four analysis charts are unchanged originals.